


With a history that goes back to 1970, the Eurobarometer has been a consistent gauge of European public sentiment, revealing patterns, convergences, and disparities. While a wealth of valuable data exists, the challenge lies in extracting meaningful trends from this extensive dataset. This paper introduces a novel approach to interpreting Eurobarometer results in a way which illuminates the intricate social divisions that exist in society. To enhance the accessibility of Eurobarometer insights, we engage in a meta-analysis of the collected data conducted by means of three constructed mega-indices: the ‘Life Satisfaction’ Index, the ‘Country Performance’ Index, and the ‘Trust in Institutions’ Index. These indices were formulated after a meticulous examination of public opinion on issues including life perception, national stability, and trust in institutions. The questions chosen to craft the indicators are consistently present in the vast majority of surveys (with very few exceptions). This approach ensures the identification of reliable and robust trends over longer periods of time. Reinterpreting Eurobarometer results through our method amplifies the nuances of societal divisions in European societies. Together, the application of these indices and the subsequent analysis enrich our understanding of public sentiment’s multifaceted nature. Based on the June 2023 Eurobarometer (EB99), we offer a few empirical insights stemming from the application of our methodology.
Read here in pdf the Working paper by Antonis Papakostas, former Head of Unit, DG Communication, European Commission and Spyros Blavoukos, Senior Research Fellow, Head, EU Institutions & Policies Programme; Head of the ‘Ariane Condellis’ European Programme, ELIAMEP; Professor, Athens University of Economics & Business.
Introduction
Taking the societal heterogeneity of EU member states as given, it is important to identify trends in social mood with reference both to everyday public concerns in various thematic fields and to the public’s overall disposition and attitude towards public institutions and the European integration process per se. The Eurobarometer offers insights that are invaluable for that aim, tracking people’s views on a series of issues in a systematic way. The data gathered is a valuable resource for all social scientists working on specific public policy issues. However, the overabundance of collected information challenges macro-analytical perspectives that require a methodologically robust synthesis of the various data collected. This is what this paper offers: a novel approach to the analysis of Eurobarometer data using three generated Social Mood Indices (SMIs). In other words, we engage in a meta-analysis of the collected data by means of three mega-indices: the ‘Life Satisfaction’ Index, the ‘Country Performance’ Index, and the ‘Trust in Institutions’ Index.
Our intention is to uncover long-term trends by observing and analysing these indices over time. Identifying changes within prevailing trends helps researchers comprehend the impact specific events have on public sentiment. This allows for enduring opinions and public sentiment to be discerned over extended periods, rather than simple temporary fluctuations. For instance, during times of governmental upheaval, shifts in the ‘Country Performance’ Index may become evident while other indices remain relatively constant. At the same time, the ‘Life Satisfaction’ Index enables the classification of individuals into two distinct groups—the satisfied and the unsatisfied. These two groups exhibit contrasting behaviours and attitudes, which yield valuable insights into a range of issues. A systematic analysis of their responses and how the Life Satisfaction Index interacts with the other two indices unveils the underlying societal dynamics at play. Identifying the varying responses of these two distinct groups to many of the Eurobarometer questions provides additional insights and sheds light on internal societal divisions within each member-state. For example, if one looks at German society’s disposition towards the European project overall, a positive outlook prevails. However, a deeper analysis reveals a striking disparity: ‘unsatisfied’ Germans hold perspectives that contrast sharply with their ‘satisfied’ compatriots, illustrating how populist parties capitalize on anti-European sentiment among disenchanted citizens. Our approach extends beyond conventional analysis to unearth differences that tend to be overshadowed by simple statistical averages. This capacity to capture significant nuances offers a useful lens through which to study the intricacies of public sentiment.
Methodological Aspects of our Meta-Analysis: Data Gathering and Index Construction
The Eurobarometer is a series of public opinion surveys conducted regularly by the European Commission. It is designed to measure public opinion on various issues concerning the EU, its institutions and policies. The surveys are carried out in all EU member states, as well as in candidate countries and other non-EU countries. It collects data on a wide range of issues including EU integration, public confidence in EU institutions and in the country, public awareness and knowledge of EU policies, economic prospects, social issues, and environmental concerns. There are a set of trend questions which allow changes in public opinion on the same issue over time to be observed. The Eurobarometer plays a crucial role, providing valuable insights into the attitudes and perceptions of EU citizens. It serves as a tool for policy makers to gauge public opinion and identify trends in public sentiment. The survey results are utilized extensively by the European Commission, EU institutions, national governments, researchers, and other stakeholders to inform decision-making processes, shape policies, and devise effective communication strategies.
Although it is a valuable tool for gathering a wide range of data that reflects social trends across diverse populations in Europe, the extensive data it collects, through numerous questions at regular intervals, raises significant interpretation challenges. The sheer volume of information makes it difficult to sift through and draw meaningful conclusions. This abundance of data can also sometimes hide crucial information that researchers and analysts are seeking, a phenomenon known as over-information. This occurs when the amount of data overwhelms the ability to process and comprehend the findings effectively. To address this, it is essential to develop tools to filter, analyse, and present the data in a way that highlights the most relevant and significant elements. This will lead to a clearer understanding of the social trends observed in Europe.
One method used to turn data into information is the creation of indices. Transforming data into an index can bring several benefits and add value to the analysis and interpretation of the data. Such indexification is valuable for the following reasons:
- Simplification: Indexing allows complex data sets to be simplified by condensing multiple variables or indices into a single value. This simplification makes it easier to compare and interpret the data.
- Standardization: Indexing enables data to be standardized, which is particularly useful when dealing with variables that have different scales or units of measurement. Transforming data into a standardized index makes it easier to compare and analyse different variables on a common scale.
- Relative Comparison: Indexing allows relative comparisons to be made over time or between different entities. By establishing a baseline or reference point, changes in the index value can indicate the direction and magnitude of shifts in the underlying variables.
- Trend Analysis: Indexing allows trends over time to be identified and analysed. Creating an index makes it possible to track changes in the aggregated data and identify patterns or shifts in the variables being measured.
- Communication and Visualization: Index values can be communicated and visualized compared more easily than raw data. Graphs or charts representing index values can provide a clear and concise representation of trends or comparisons, making it easier for stakeholders to understand and interpret the information.
- Policy and Decision-making: Indexed data can be valuable for policy development and decision-making processes. Condensing and simplifying data into an index allows policymakers to quickly assess and compare the relative performance of different entities or variables, informing their choices and actions.
Bearing in mind the usefulness of indices, we put forward three social indices to analyse European social mood contributing to the better understanding of social mood within a society. This information can be valuable for policymakers, sociologists, and other professionals seeking insights into public sentiment and its potential impact on various aspects of society. The questions chosen for the construction of the indices appear in all questionnaires over time, which enables data gathering in a standardized manner and enhances the consistency and across-time comparability of the findings. The detailed methodology outlining the construction of these indices and the questions used can be found in Appendix I.
The three indices assess how citizens measure their:
- Life satisfaction: This index involves evaluating how individuals perceive their own lives, including aspects such as their personal well-being, job satisfaction, and financial situation. It seeks to determine whether people generally view these aspects positively or negatively.
- Country’s performance: This index focuses on assessing how individuals perceive the overall state of their country. It considers factors such as the state of the government, the economy, and the labour market. People are asked to evaluate these aspects as positive or negative, providing an indication of their sentiment towards the country’s performance.
- Trust in institutions: This index measures individuals’ trust and confidence in various institutions within the country, specifically the government, parliament, judiciary, and political parties. It seeks to gauge whether people believe that their opinions are taken into account when decisions are made by these institutions.
The first index alludes to the critical issue of social cohesion and social fragmentation. Social cohesion refers to the degree to which unity, cooperation, and solidarity within a society create a harmonious environment in which individuals and groups share a sense of belonging, shared values, and mutual trust. Societies with strong social cohesion tend to be more stable, resilient, and inclusive, fostering the collective well-being of their members. Conversely, social fragmentation or disintegration occurs when a society lacks cohesion, leading to divisions, conflicts, and inequalities. Fragmentation presents challenges including polarization, exclusion, and the breakdown of social bonds. It hampers progress, undermines social harmony, and weakens the overall fabric of the community. Promoting social cohesion requires concerted efforts to bridge divides, foster understanding, and cultivate a sense of unity and shared purpose. This involves valuing diversity, promoting equal opportunities, and addressing the underlying causes of social inequalities. In survey research, classical demographic variables serve as valuable independent variables for comparative analysis. Researchers can leverage these variables to examine how survey responses differ among various groups, such as gender or age cohorts. This comparative analysis helps identify relationships between demographic characteristics and survey responses, providing insights into potential disparities or trends.
In our analysis, the ‘Life Satisfaction’ Index enables the creation of a new dichotomous variable which captures “satisfied” and “unsatisfied” citizens. Categorizing individuals as either “satisfied” or “unsatisfied” allows for a comparative analysis of responses between different segments of one society, but also across member states. Considering these contrasting perspectives and priorities allows for a comprehensive understanding of the complexities and diverse attitudes within different populations, leading to better informed decisions and policies to address the needs and aspirations of both groups. Efforts to enhance social cohesion are crucial for building a resilient and thriving society. They enable individuals from diverse backgrounds to come together, respect one another, and collectively tackle challenges. Strong social cohesion empowers societies to effectively address issues such as poverty, discrimination, and social injustice, fostering a more equitable and sustainable future for all.
Applying the ‘Social Mood Indices’
A First Glance
Table 1 presents an overview of the EU member states’ scores on the three indices. The analysis is based on the June 2023 Eurobarometer (EB99). Two general insights can be derived at first glance: first, citizens feel more positively about their personal status than their country’s performance, and second, there is a high correlation between citizens’ perspectives on a country’s performance and the ‘trust in institutions’ index.
|
TABLE 1: SOCIAL MOOD INDICES for the EU Member States (EB99, June 2023)
|
|||
| MEMBER STATE | LIFE SATISFACTION | COUNTRY PERFORMANCE | TRUST PERFORMANCE |
| Austria | 0.36 | 0.05 | 0.04 |
| Belgium | 0.36 | 0.10 | -0.15 |
| Bulgaria | 0.08 | -0.41 | -0.54 |
| Cyprus | 0.34 | -0.19 | -0.36 |
| Czech Republic | 0.41 | -0.06 | -0.24 |
| Germany | 0.38 | 0.03 | -0.10 |
| Denmark | 0.73 | 0.61 | 0.43 |
| Estonia | 0.33 | -0.05 | -0.25 |
| Greece | 0.11 | -0.43 | -0.36 |
| Spain | 0.34 | -0.29 | -0.37 |
| Finland | 0.62 | 0.18 | 0.40 |
| France | 0.31 | -0.23 | -0.43 |
| Croatia | 0.29 | -0.19 | -0.29 |
| Hungary | 0.23 | -0.08 | -0.20 |
| Ireland | 0.57 | 0.27 | 0.08 |
| Italy | 0.26 | -0.23 | -0.31 |
| Lithuania | 0.33 | -0.06 | -0.43 |
| Luxemburg | 0.56 | 0.44 | 0.41 |
| Latvia | 0.32 | -0.15 | -0.35 |
| Malta | 0.43 | 0.09 | -0.31 |
| Netherlands | 0.66 | 0.40 | 0.10 |
| Poland | 0.36 | 0.03 | -0.24 |
| Portugal | 0.23 | -0.17 | -0.15 |
| Romania | 0.09 | -0.26 | -0.36 |
| Sweden | 0.63 | 0.14 | 0.25 |
| Slovenia | 0.41 | 0.09 | -0.39 |
| Slovakia | 0.22 | -0.32 | -0.38 |
| United Kingdom | 0.48 | -0.26 | -0.39 |
We observe that countries with the best results in life satisfaction also have the best results in the other two indicators (i.e. Denmark, Finland, Ireland, Luxembourg, the Netherlands, and Sweden). Countries with a lower performance in the ‘Life Satisfaction Index’ also reveal a lower performance in the other indicators. There would therefore seem to be a strong correlation between the three indices. Based on Table 1, the EU member states can be categorized into three clusters. In Greece, Bulgaria, Slovakia, Italy, and Romania, all three indices have a low score compared to the other member states, portraying a prevailing and overarching sense of general dissatisfaction. Then in Spain, France, Croatia, Hungary, Latvia, Cyprus, Portugal, Lithuania, Malta, Slovenia, and the United Kingdom (the latter still included in the Eurobarometer survey despite Brexit), satisfaction levels appear to remain in a middle ground devoid of pronounced highs or lows. Finally, Germany, Austria, Ireland, Belgium, Czech Republic, Estonia, Poland, and Sweden exhibit positive scores. Within this group, Finland, Netherlands, Luxembourg, and Denmark emerge as exceptional performers in terms of satisfaction, consistently displaying elevated contentment levels across a diverse range of variables. It is important to emphasise that the scores in Table 1 are average-based and do not capture the intricate nuances present within each country and between different groups (‘satisfied’- ‘unsatisfied’).
Identifying Trends and Critical Political Junctures
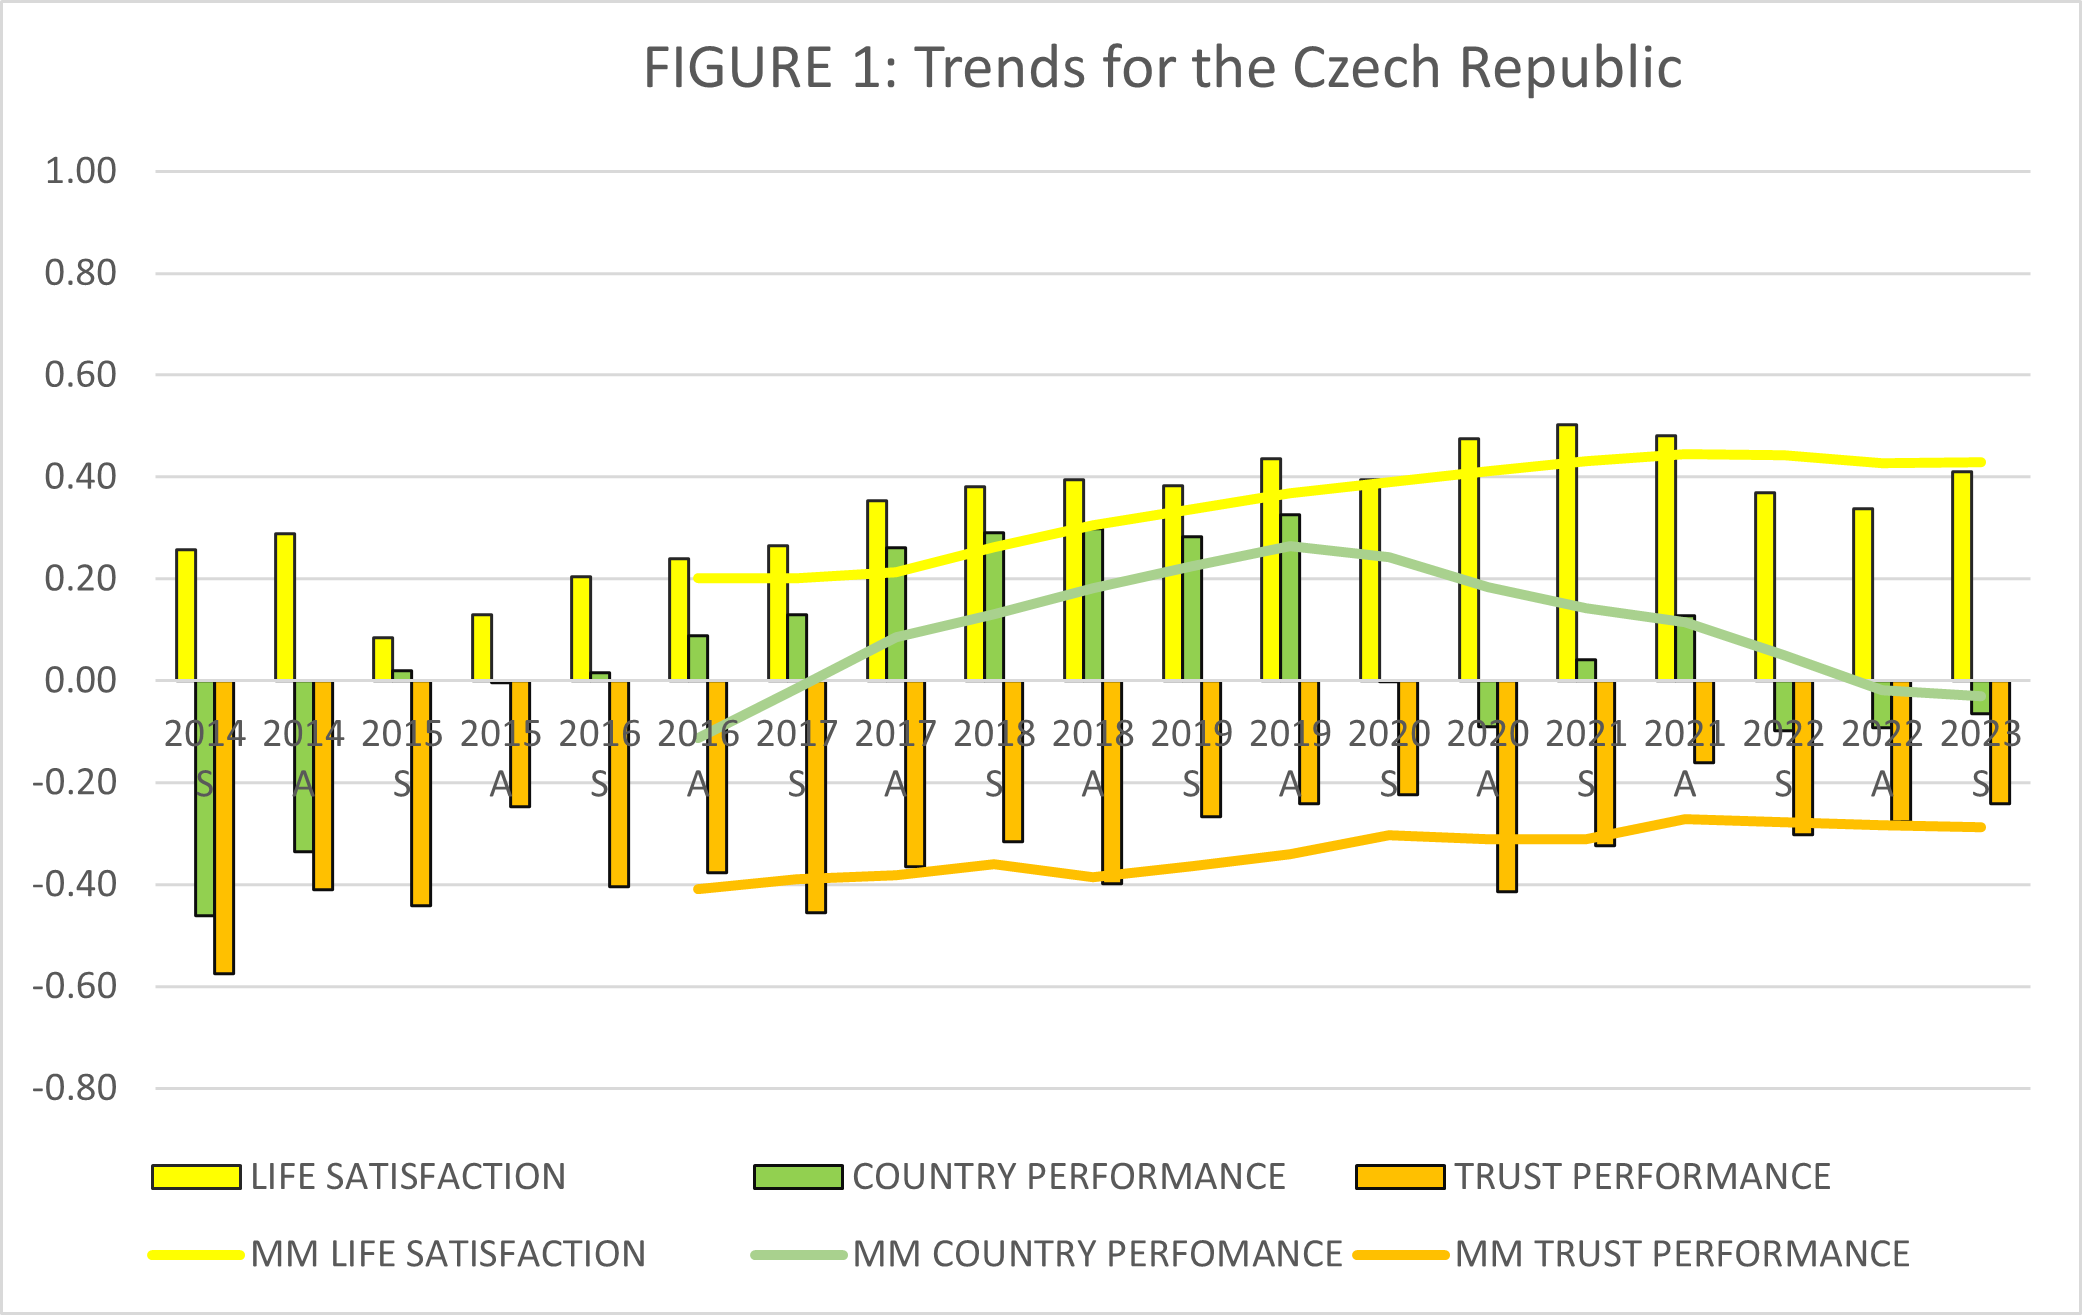
One of the benefits of using Eurobarometer data is that it allows the evolution of the three indices to be traced over time and the identification of critical political junctures within a country that may profoundly influence all three indices, but especially the ‘Country Performance’ Index. This is evident in the three examples below. In the Czech Republic, there is a noteworthy decline of 0.33 points in the ‘Country Performance’ index in early 2020 (Figure 1). This drop reflects the crisis which the country’s government faced in 2019 and early 2020. The then-Prime Minister, Andrej Babiš, and his administration faced allegations of conflicts of interest and corruption. These were followed by widespread protests and calls for his resignation. This crisis exposed public discontent regarding political ethics and transparency.
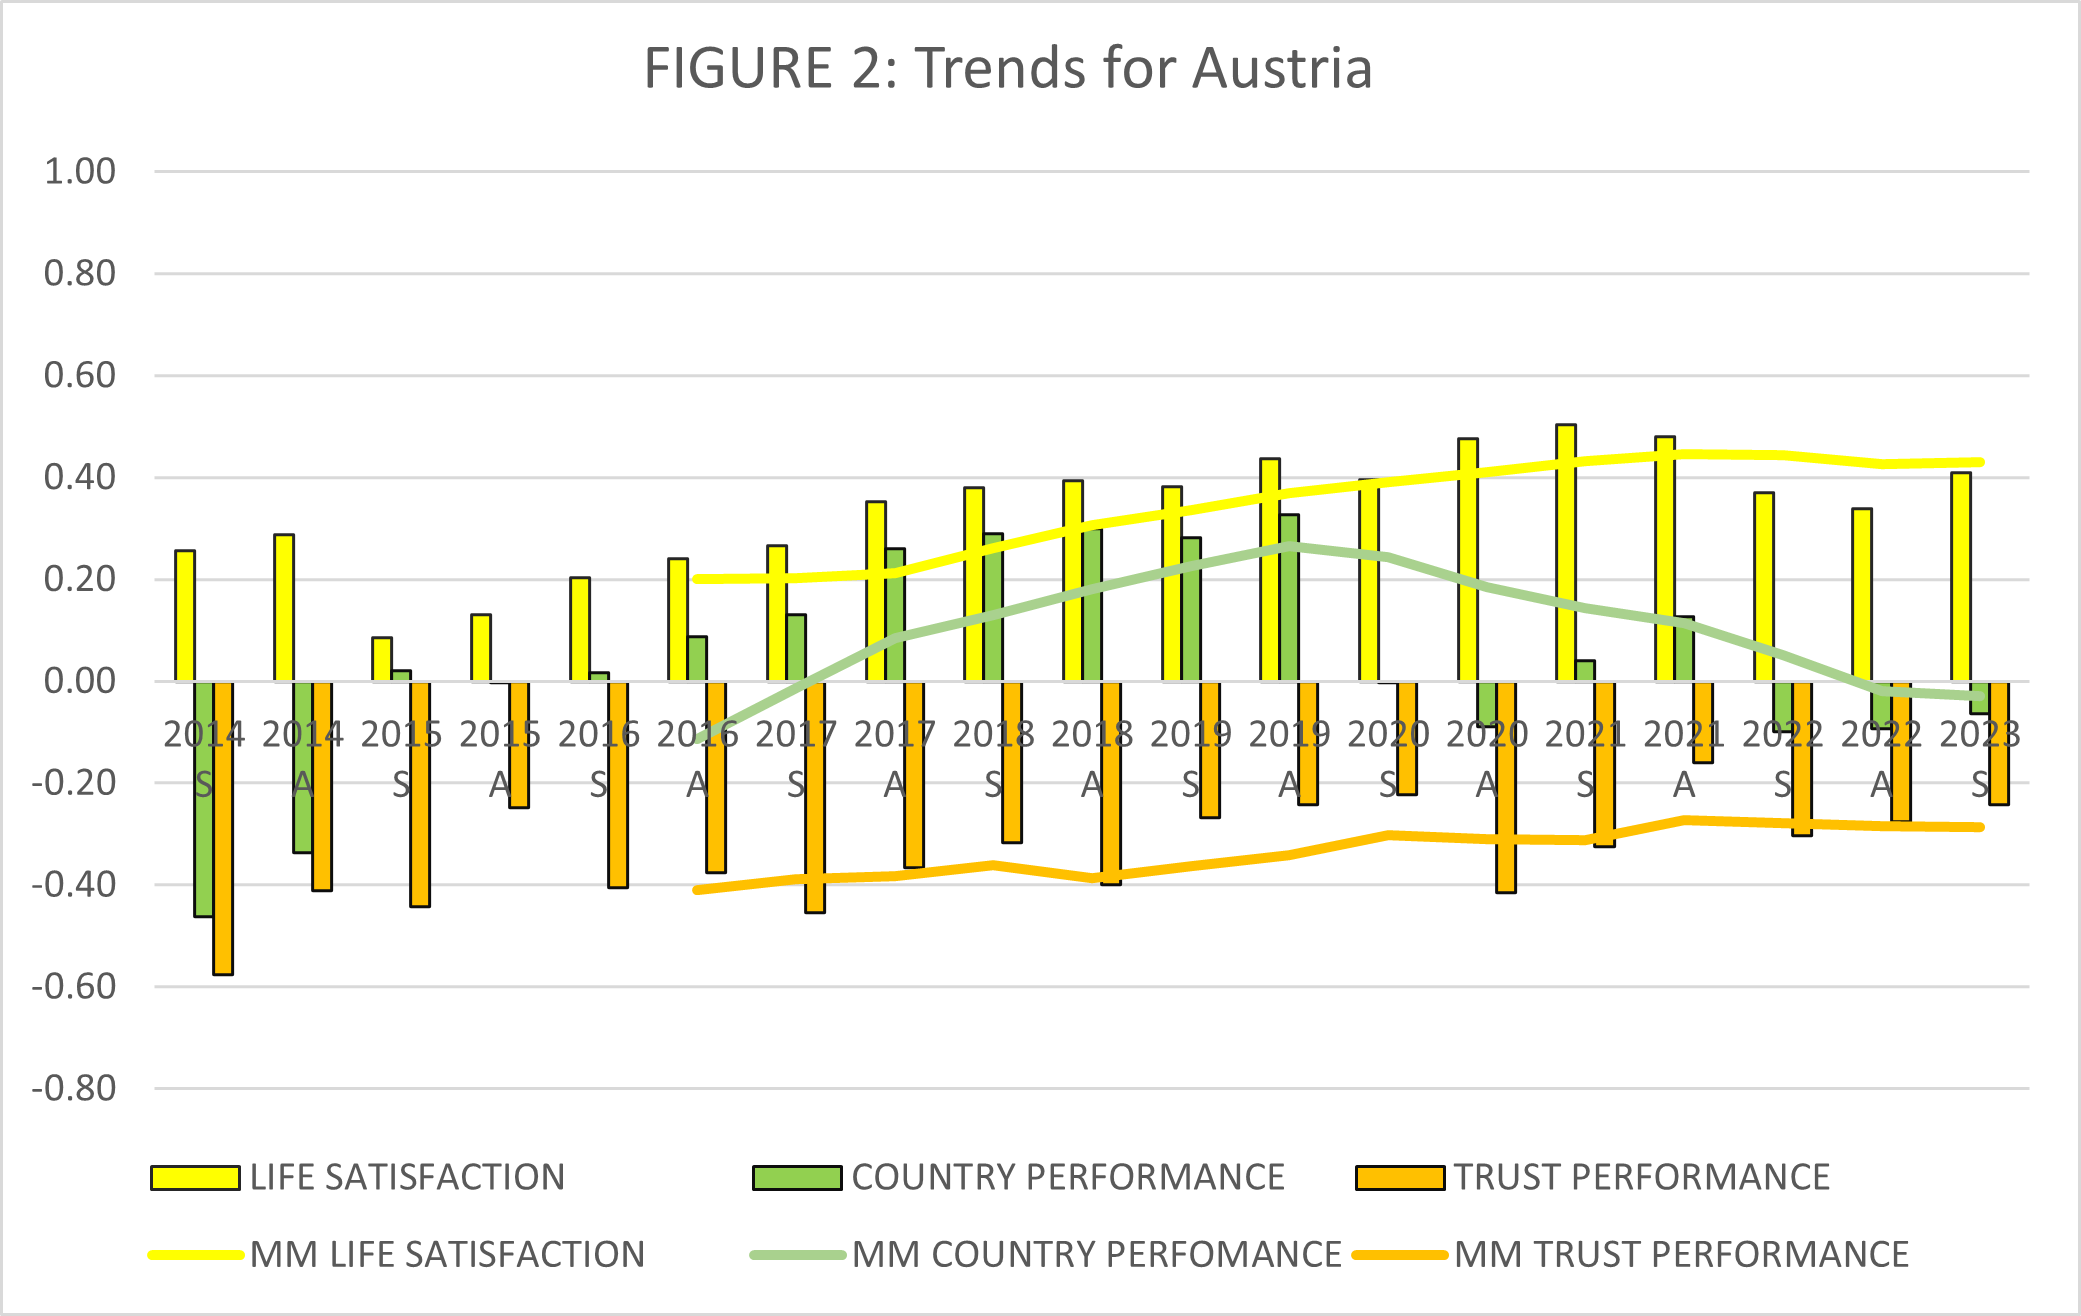
In Austria, a significant fall in the same index during the same year can be attributed to some extent to the so-called Ibiza scandal (Figure 2). The scandal involved the release of a covertly recorded video featuring the leader of the far-right Freedom Party of Austria (FPÖ), Heinz-Christian Strache, allegedly discussing corrupt practices and offering government contracts in exchange for political support. Strache resigned as a result of the scandal, and the coalition government, in which the FPÖ and the Austrian People’s Party (ÖVP) were participating, collapsed.
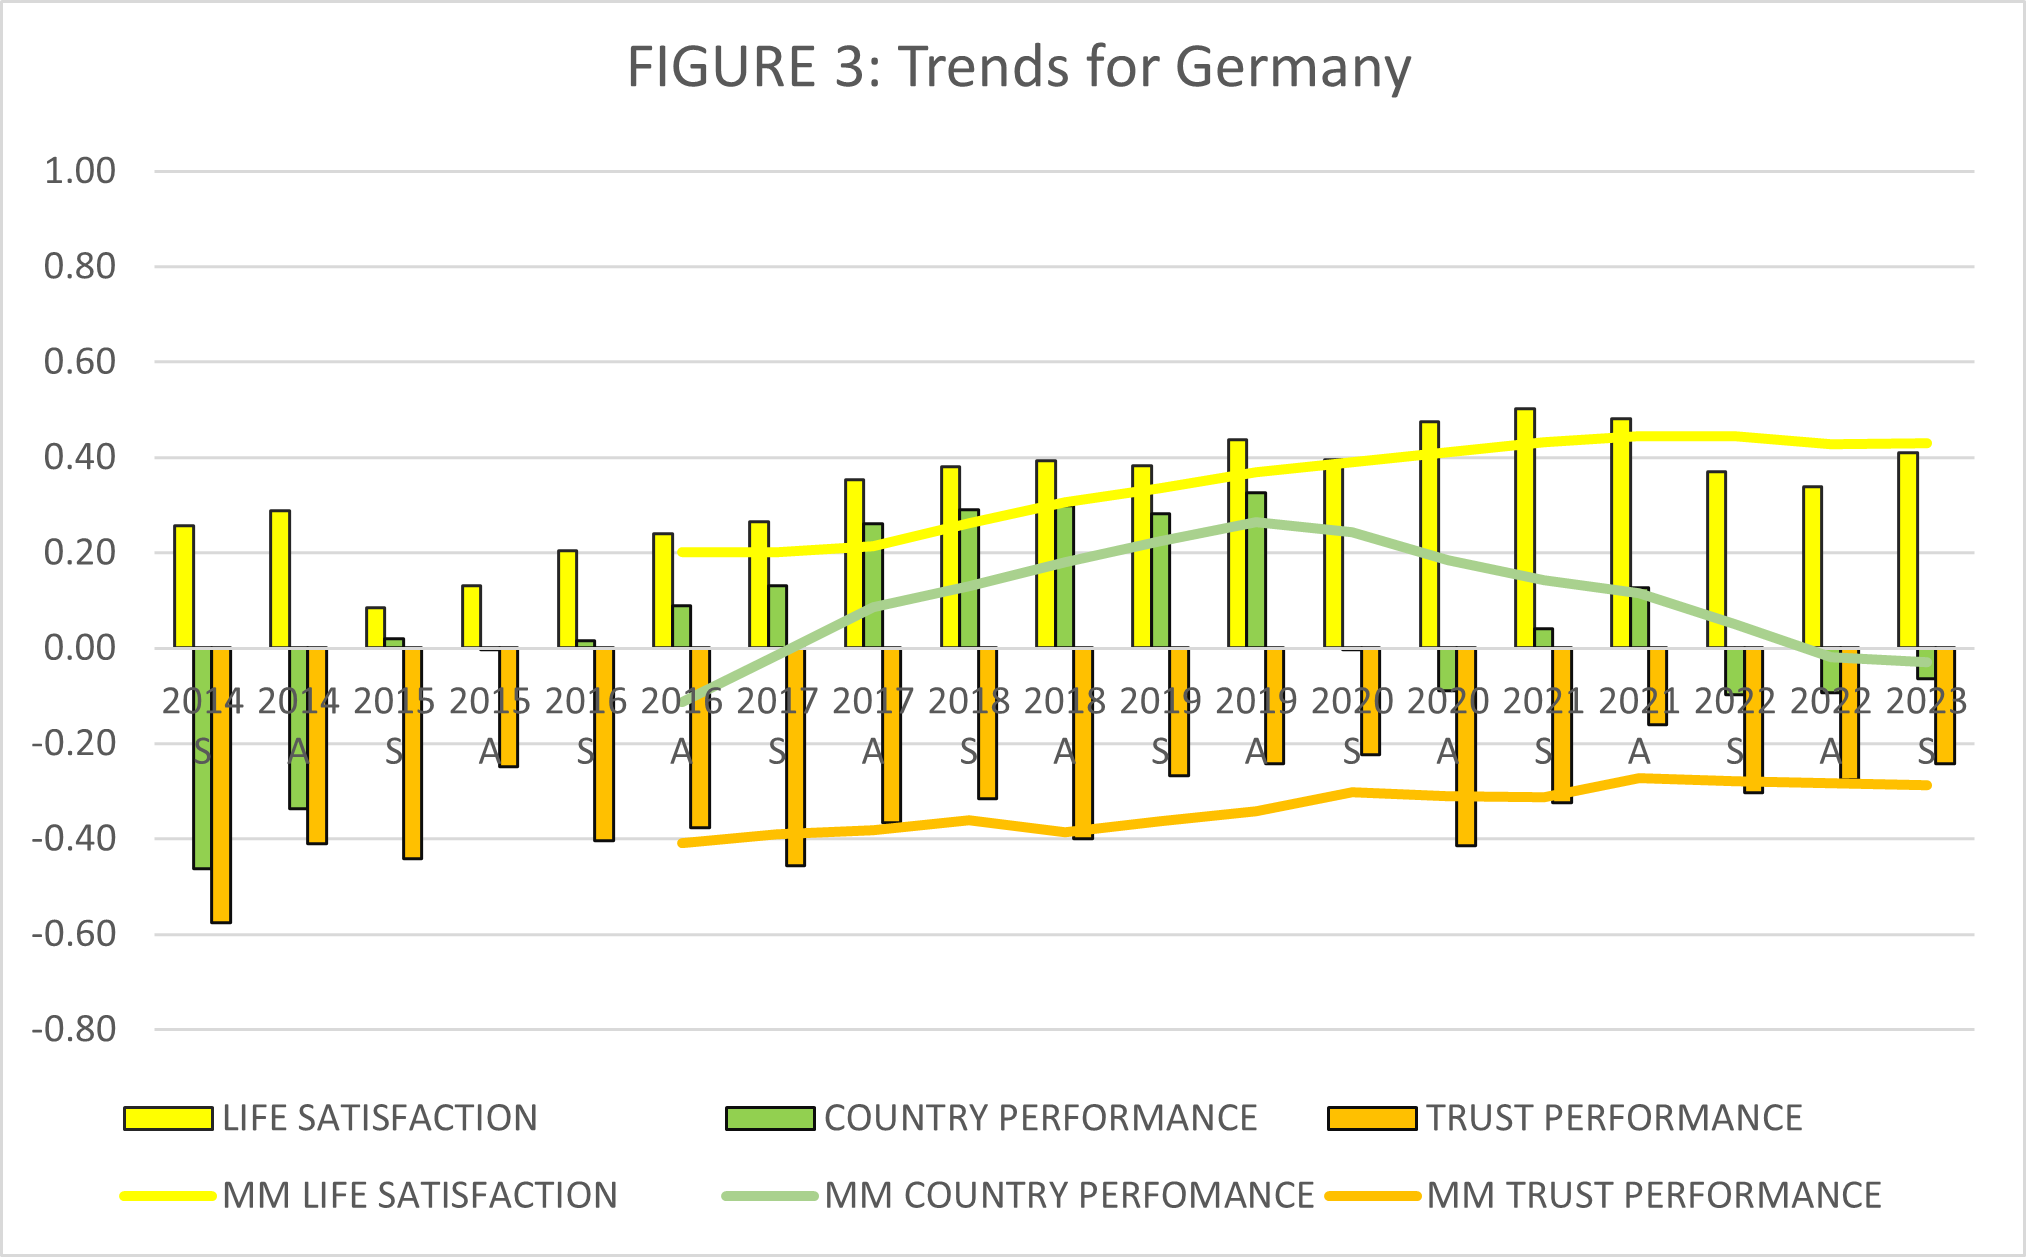
In Germany, although the index has remained positive, it also dropped substantially, in this case over the last three years (2020–23) (Figure 3). This drop is primarily associated with public dissatisfaction with the management of the COVID-19 pandemic and the vaccination campaign, which initially ran into severe logistical challenges and supply shortages, as well as with the change of government after Chancellor Angela Merkel’s 16-year tenure.
‘Satisfied’ vs ‘Unsatisfied’
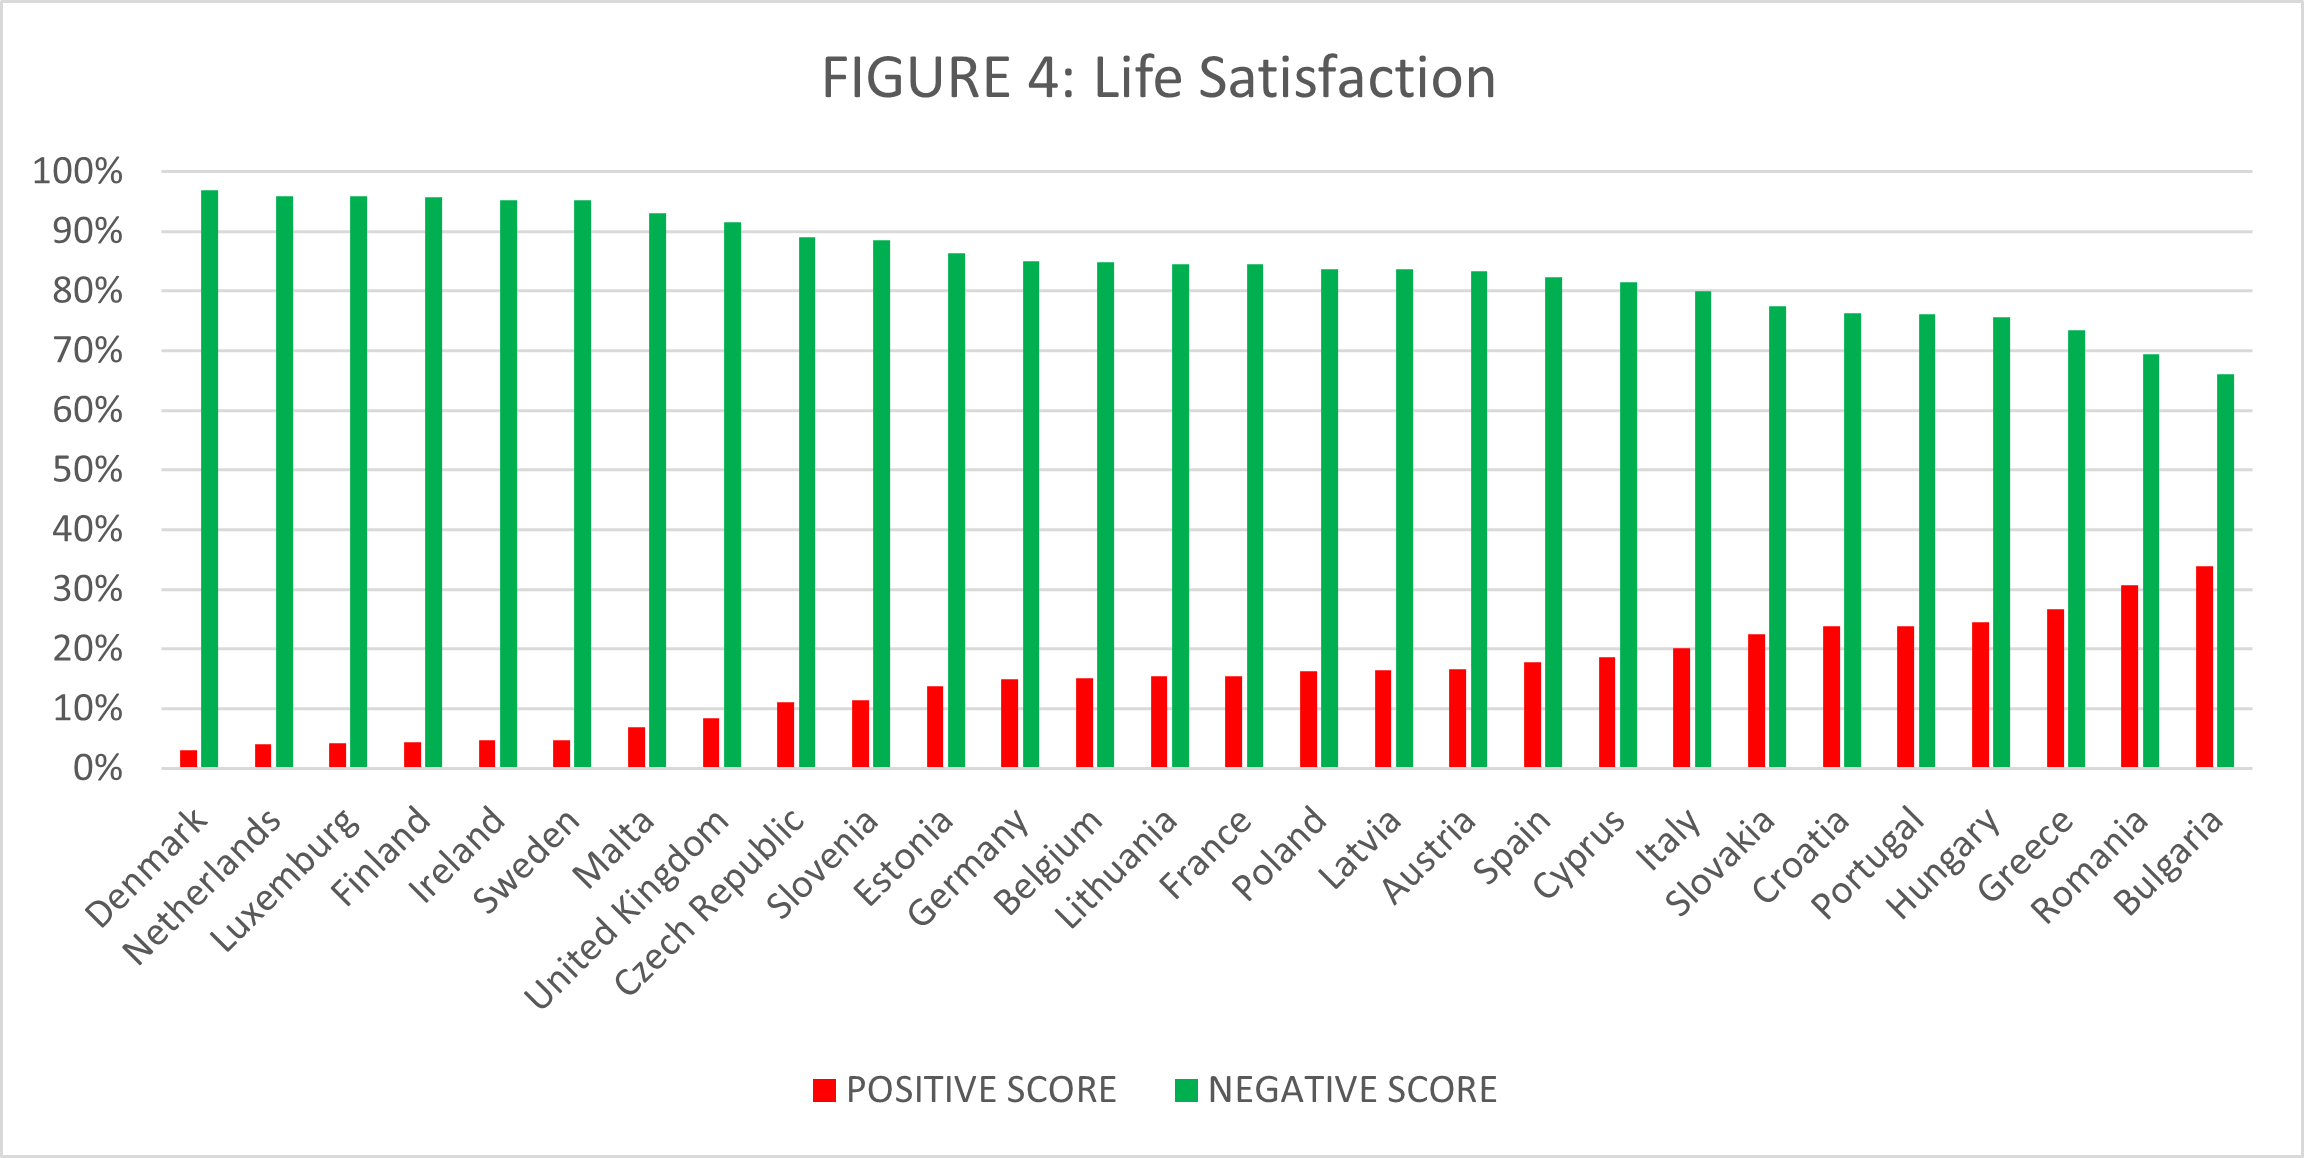
Delving deeper into the EB99, it is interesting to examine the different perspectives presented by the ‘satisfied’ and ‘unsatisfied’ citizens of EU member states. Figure 4 offers an overview of these two groups in each member-state, with Greece, Romania and Bulgaria featuring the highest numbers of citizens unsatisfied with the current state of their life.[2]
In a deeper analysis of the available data, we have picked two specific EB questions to analyze in terms of this societal dichotomy: first, what Europe means to the citizens interviewed and second, what interviewees think about their country leaving the EU.
What does Europe mean to you?
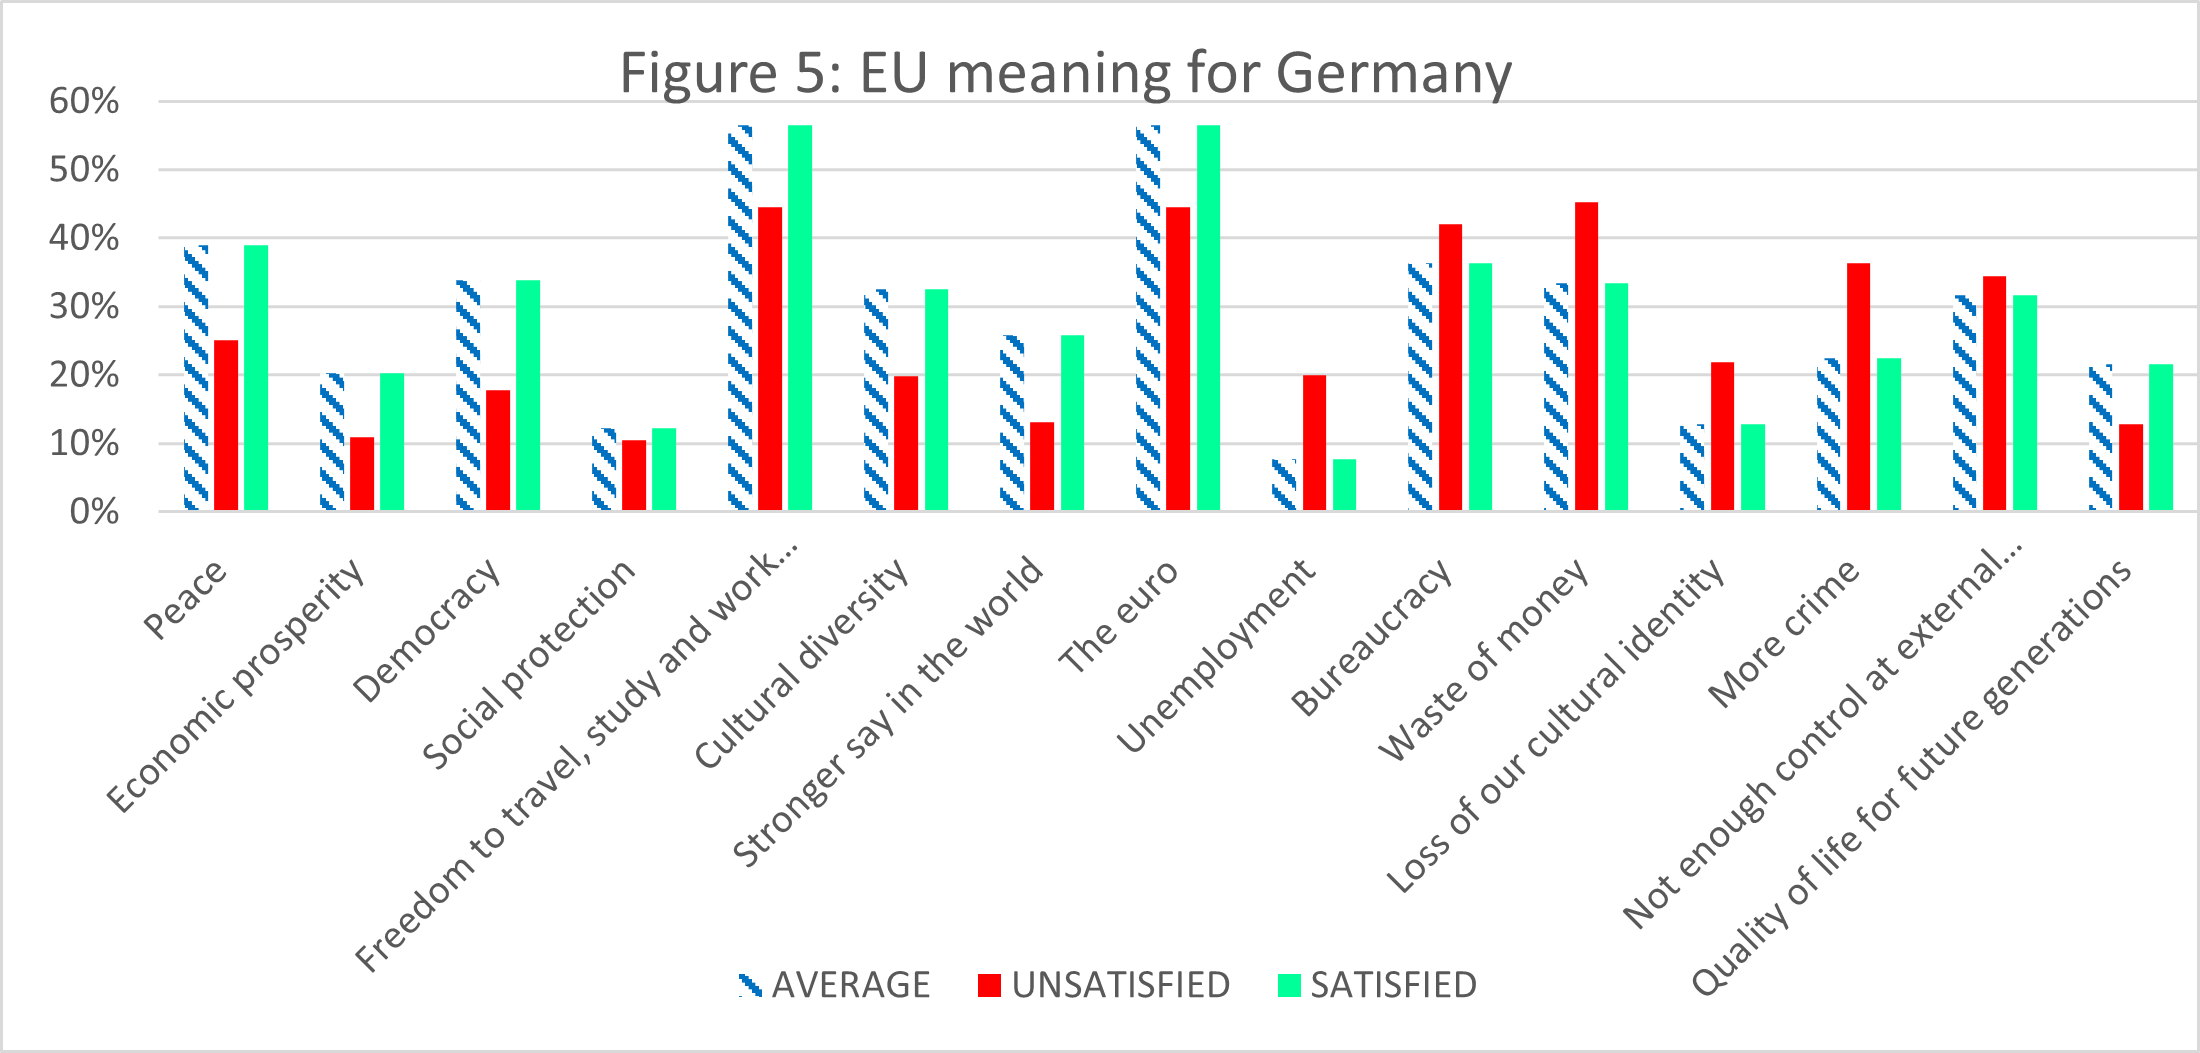
In this question, respondents are presented with a range of fifteen proposals to choose from. These proposals comprise six positive aspects, six negative aspects, and three neutral options. The choices include concepts such as peace, economic prosperity, democracy, social protection, freedom of movement, cultural diversity, stronger global influence, the euro, unemployment, bureaucracy, wasteful spending, loss of cultural identity, increased crime, insufficient international border controls, and the quality of life for future generations. The following figure offers an overview of what ‘satisfied’ and ‘unsatisfied’ EU citizens feel about these issues.
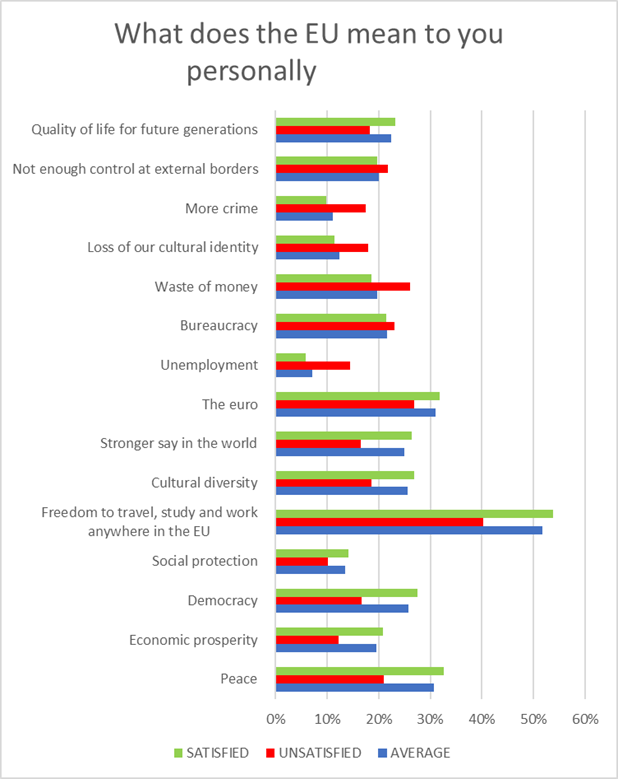
In Germany, for example, within the cohort of ‘satisfied’ individuals, 39% identify peace and 34% identify democracy as the core concepts embodying Europe (Figure 5). In contrast, 45% of the ‘unsatisfied’ segment consider Europe as tantamount to wasteful spending. This stark contrast underscores the existence of a vulnerable subgroup that endorses and/or is susceptible to anti-European rhetoric. The same holds in other countries, like Cyprus, where the gap between the two groups is also substantial. This information usually passes under the radar when we observe and use country-wide averages without considering the dichotomy between these two groups of citizens.
Leaving the EU
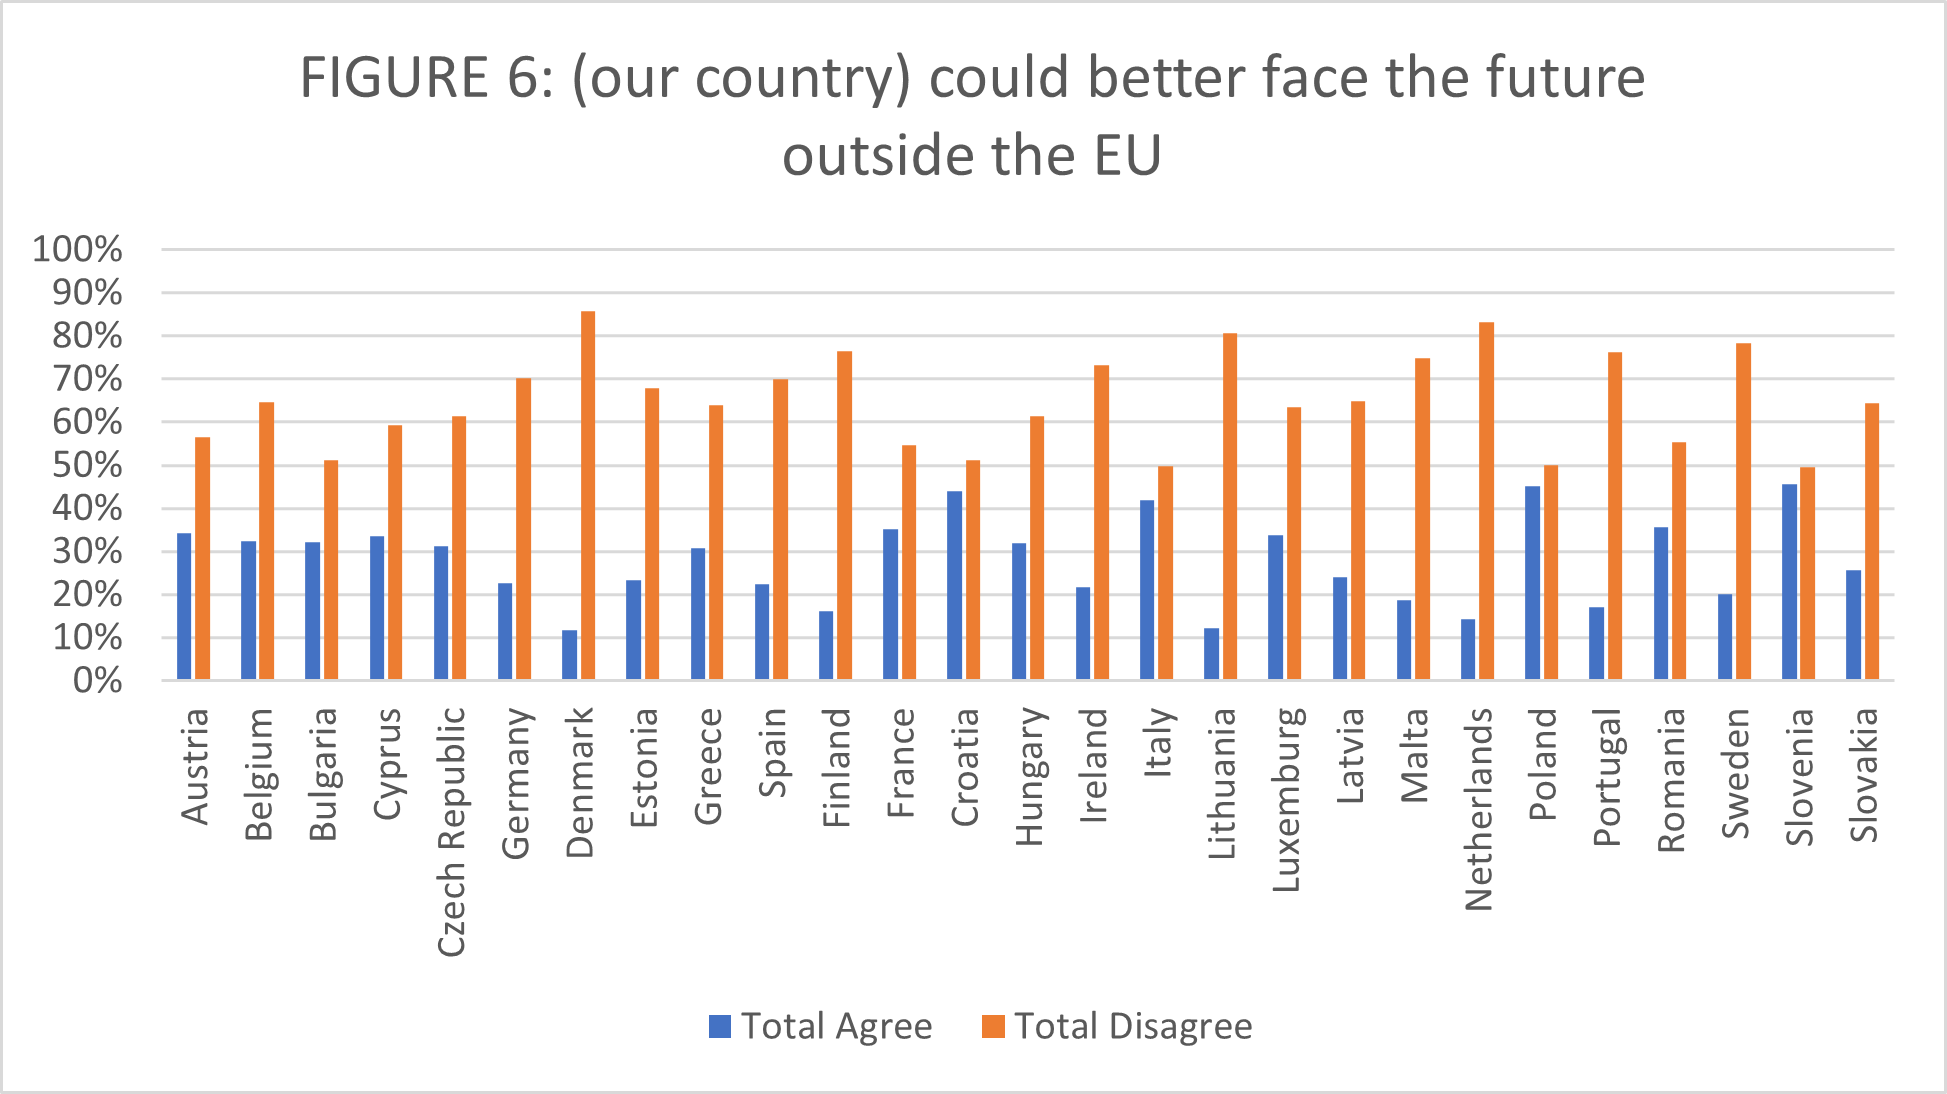
When it comes to the question of exiting the EU, when one looks at the average, most citizens in all member states clearly oppose the idea. In some member states (like Poland, Slovenia, Italy and Croatia), there is considerable support for exiting, but this falls short of a majority (Figure 6).
The two groups (‘satisfied’—‘unsatisfied’) respond differently to this question in all countries, as shown in Table 2.
|
TABLE 2: Exiting the EU—‘Satisfied’ vs ‘Unsatisfied’
|
||||
| UNSATISFIED | SATISFIED | |||
| AGREE | DISAGREE | AGREE | DISAGREE | |
| Austria | 42% | 51% | 34% | 59% |
| Belgium | 43% | 53% | 33% | 65% |
| Bulgaria | 36% | 43% | 30% | 60% |
| Cyprus | 35% | 58% | 38% | 55% |
| Czech Republic | 48% | 43% | 28% | 67% |
| Germany | 43% | 47% | 21% | 73% |
| Denmark | 14% | 86% | 11% | 87% |
| Estonia | 37% | 53% | 21% | 73% |
| Greece | 37% | 57% | 28% | 69% |
| Spain | 24% | 68% | 23% | 71% |
| Finland | 23% | 74% | 16% | 78% |
| France | 45% | 44% | 35% | 57% |
| Croatia | 38% | 55% | 48% | 48% |
| Hungary | 30% | 61% | 35% | 61% |
| Ireland | 42% | 55% | 21% | 75% |
| Italy | 42% | 52% | 45% | 49% |
| Lithuania | 15% | 72% | 11% | 84% |
| Luxemburg | 40% | 49% | 35% | 62% |
| Latvia | 32% | 51% | 22% | 69% |
| Malta | 35% | 64% | 17% | 78% |
| Netherlands | 25% | 61% | 13% | 85% |
| Poland | 47% | 51% | 47% | 50% |
| Portugal | 18% | 74% | 17% | 79% |
| Romania | 41% | 54% | 36% | 60% |
| Sweden | 22% | 70% | 20% | 79% |
| Slovenia | 48% | 45% | 47% | 49% |
| Slovakia | 39% | 50% | 21% | 72% |
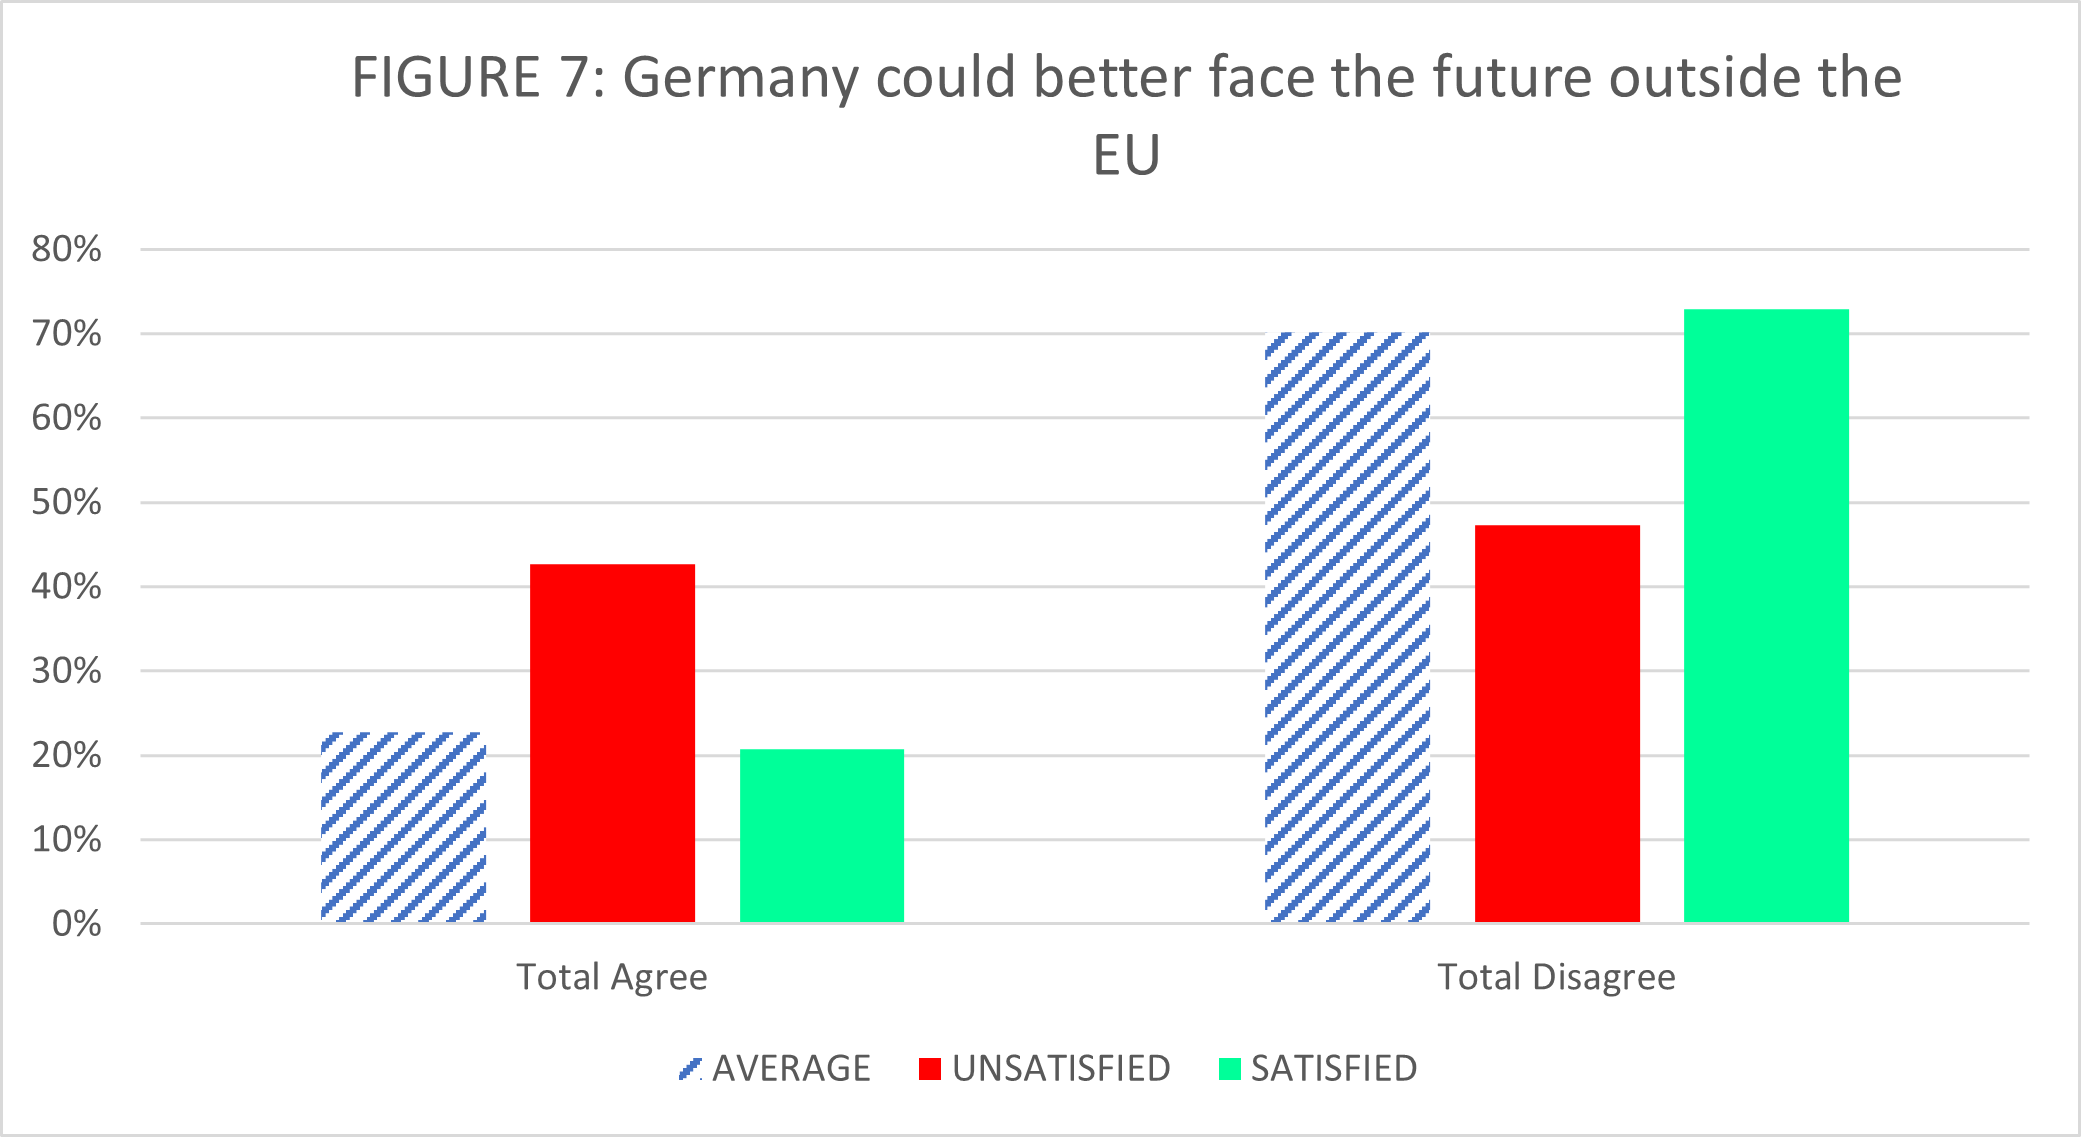
In some member states, close to 50% of the ‘unsatisfied’ segment of the society support their nation’s exit from the EU. Most worryingly, this includes France and to a lesser extent Germany (as well as the Czech Republic, Poland and Slovenia). This is not the case in other member states (Sweden, Denmark, Lithuania to name a few), where even the ‘dissatisfied’ citizens endorse their country’s European perspective. That said, even among the ‘satisfied’ strata of the population, a significant portion are positive with regard to their country’s exit from the EU (Poland, Croatia and Slovenia top this list). In other words, the prevailing view that social discontent triggers anti-EU feelings is only partially true. People may be satisfied with their own personal condition in life but still become negatively disposed towards the EU (and vice versa, suggesting that not every ‘dissatisfied’ citizen places the blame on the EU). Germany serves as an illustrative example here (Figure 7). Although the overall average of individuals who reject the idea of leaving the EU is high at 73%, with only 21% supporting it, within the unsatisfied subgroup this ratio becomes balanced (47% rejecting the idea and 43% supporting it). This represents a clear shift from the initial perception. Recognizing this trend enables targeted information campaigns to be planned; understanding the profile of the ‘unsatisfied’ individuals helps these efforts to be directed effectively.
‘Social Mood Indices’: Insights for Greece
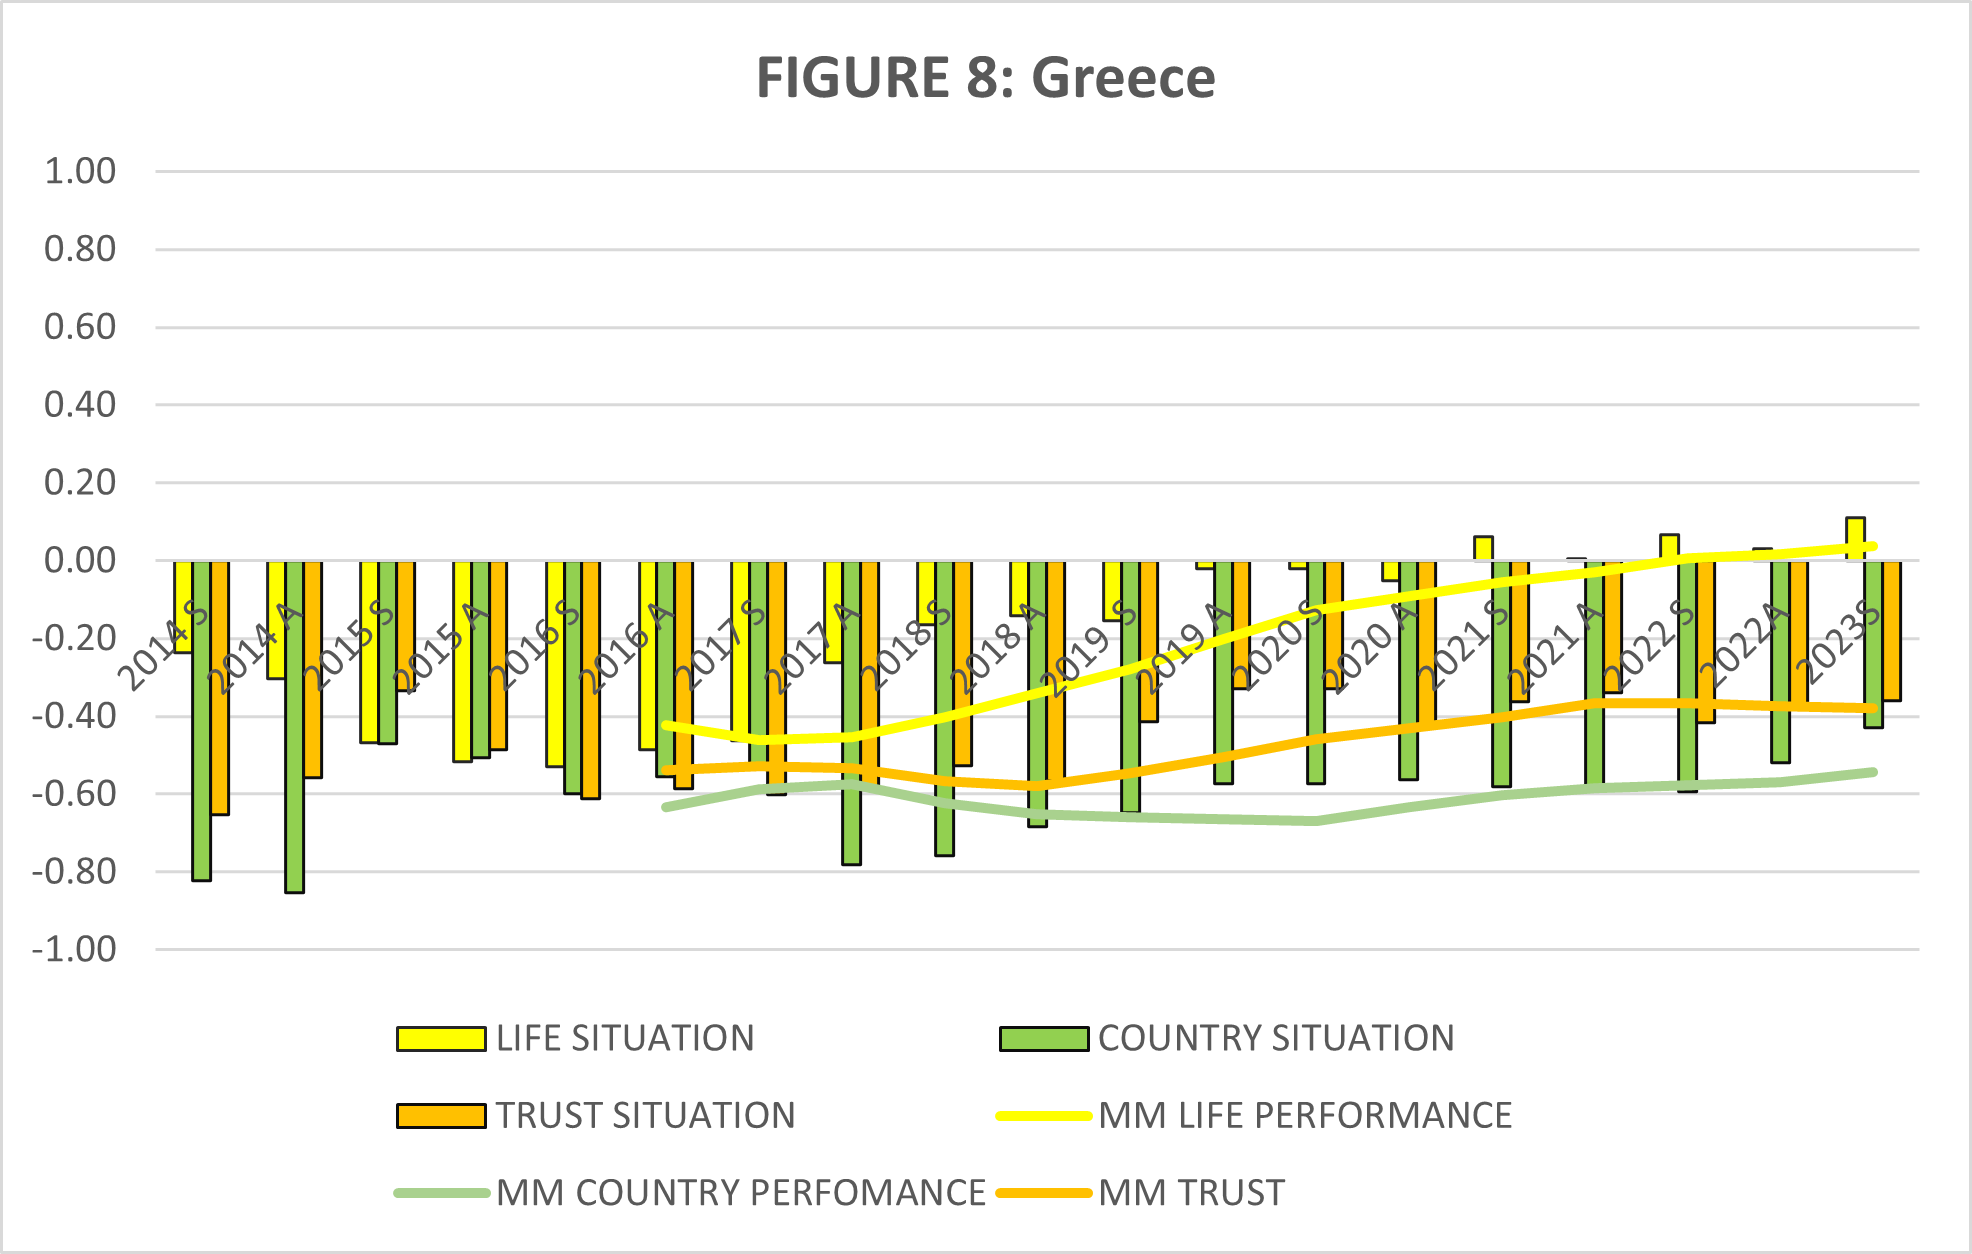
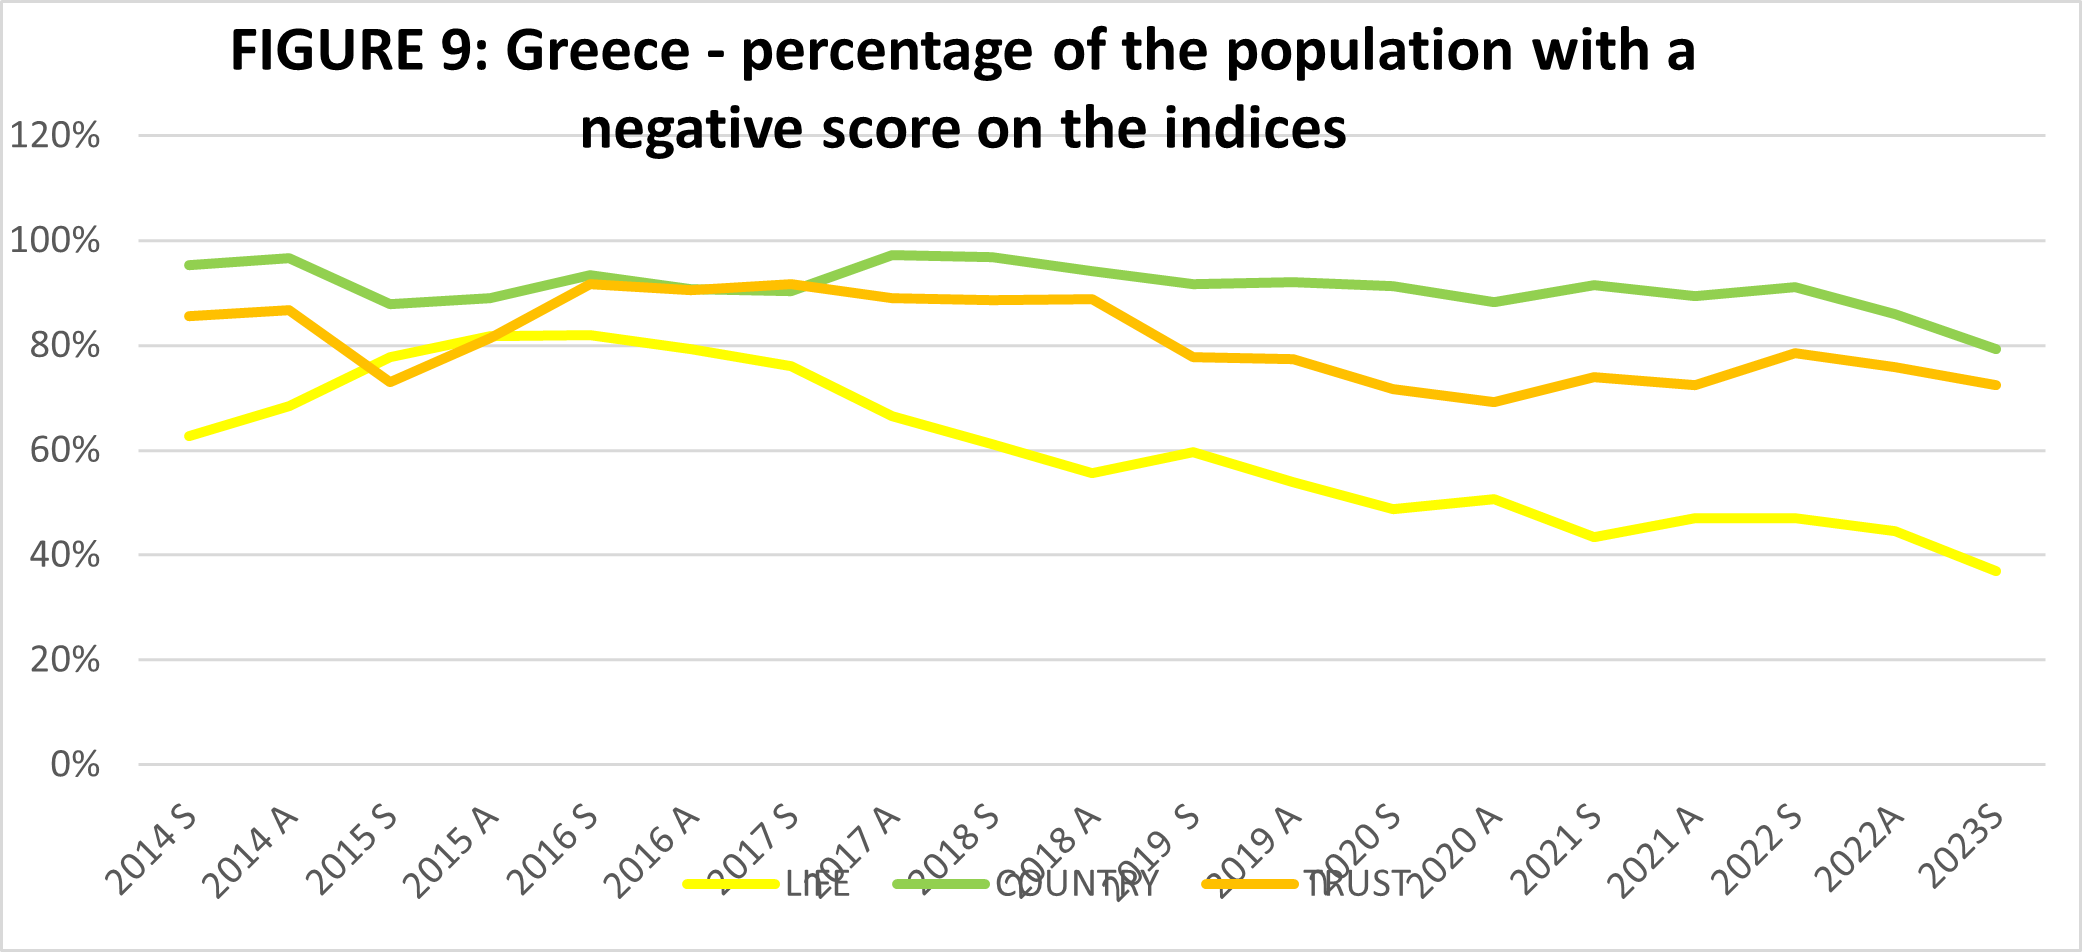
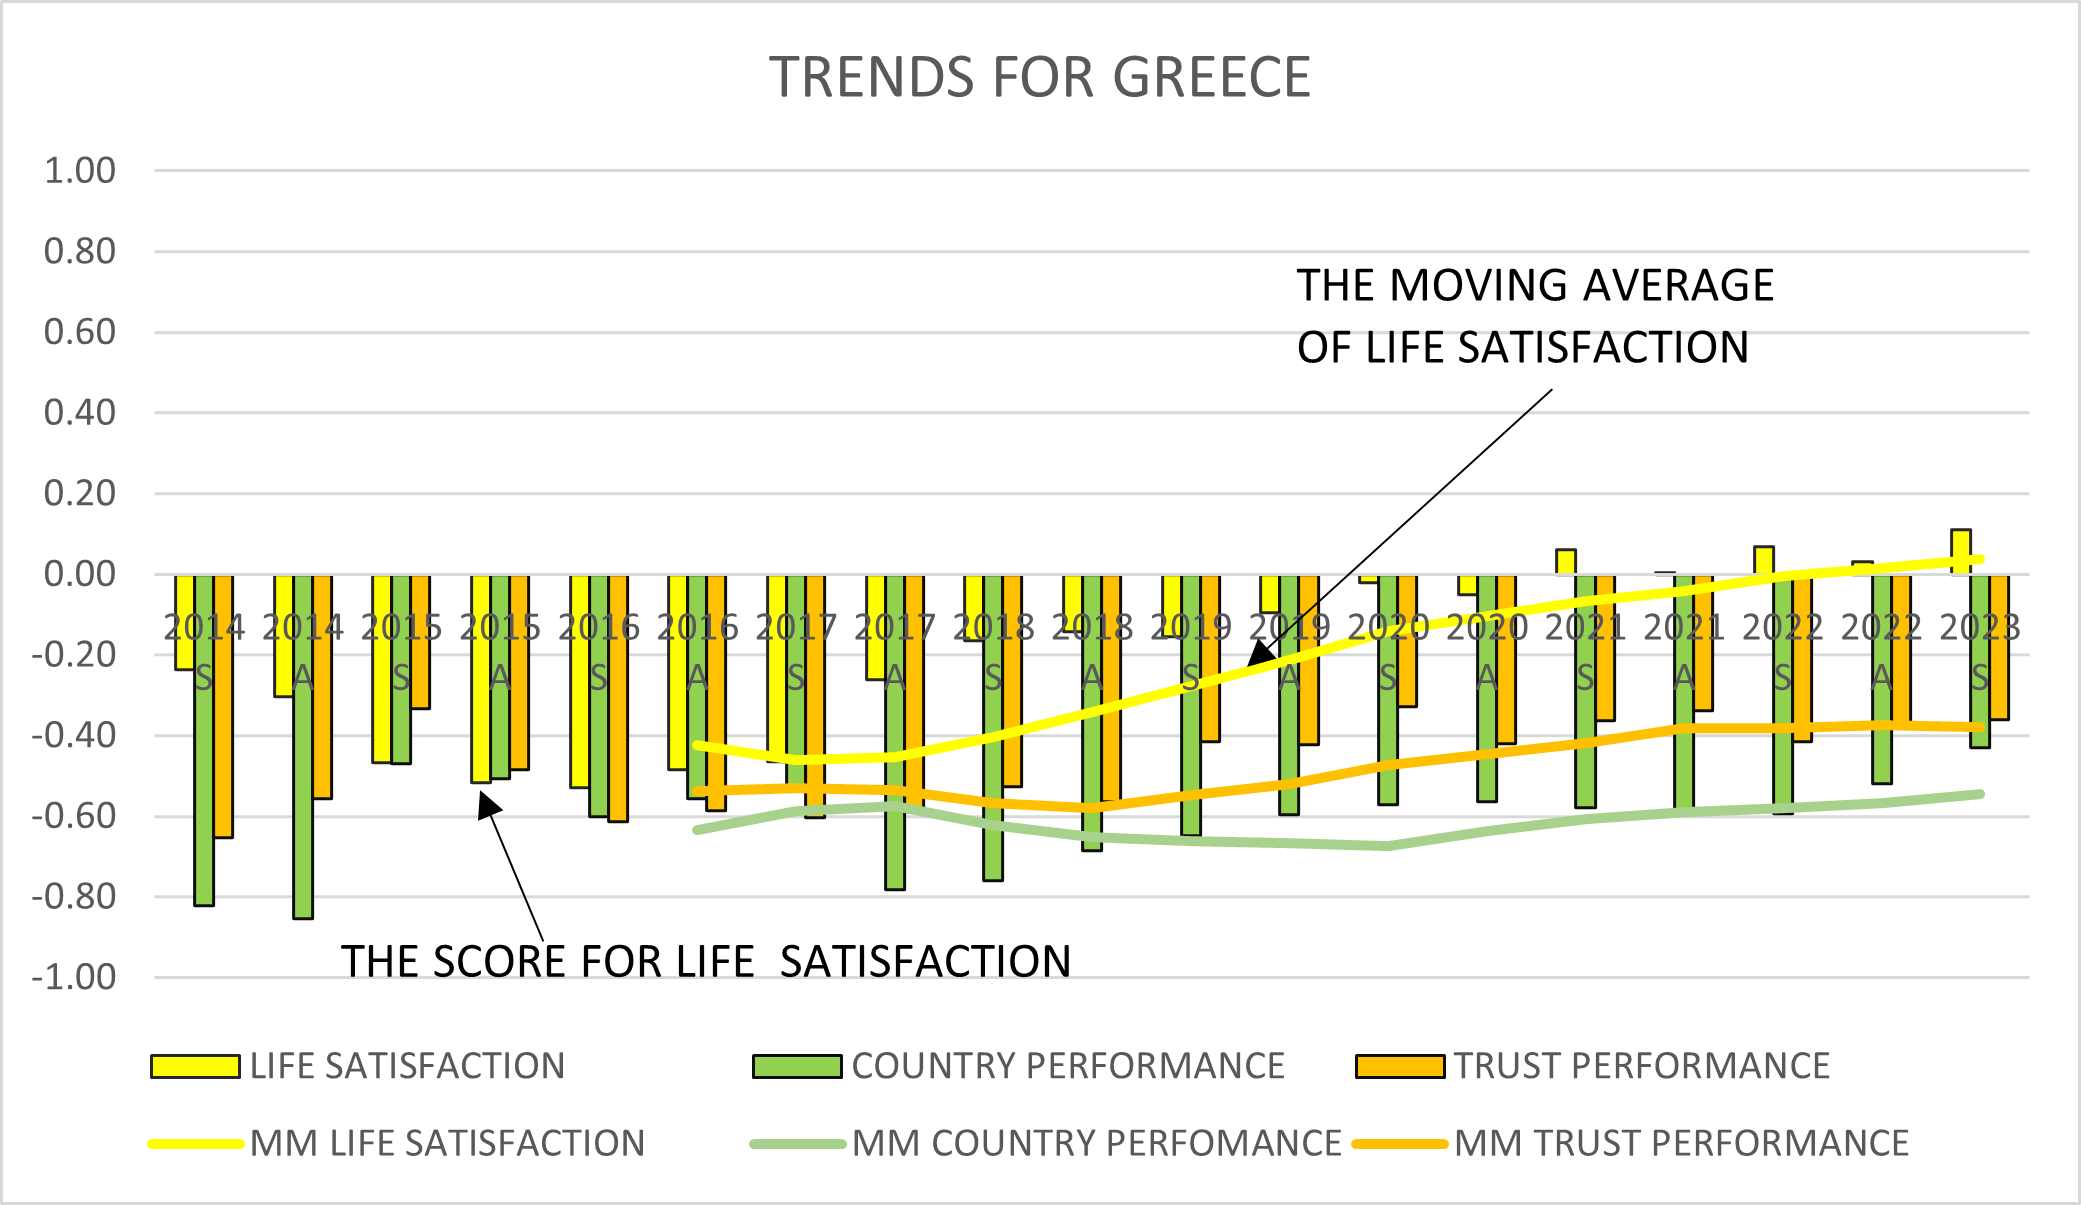
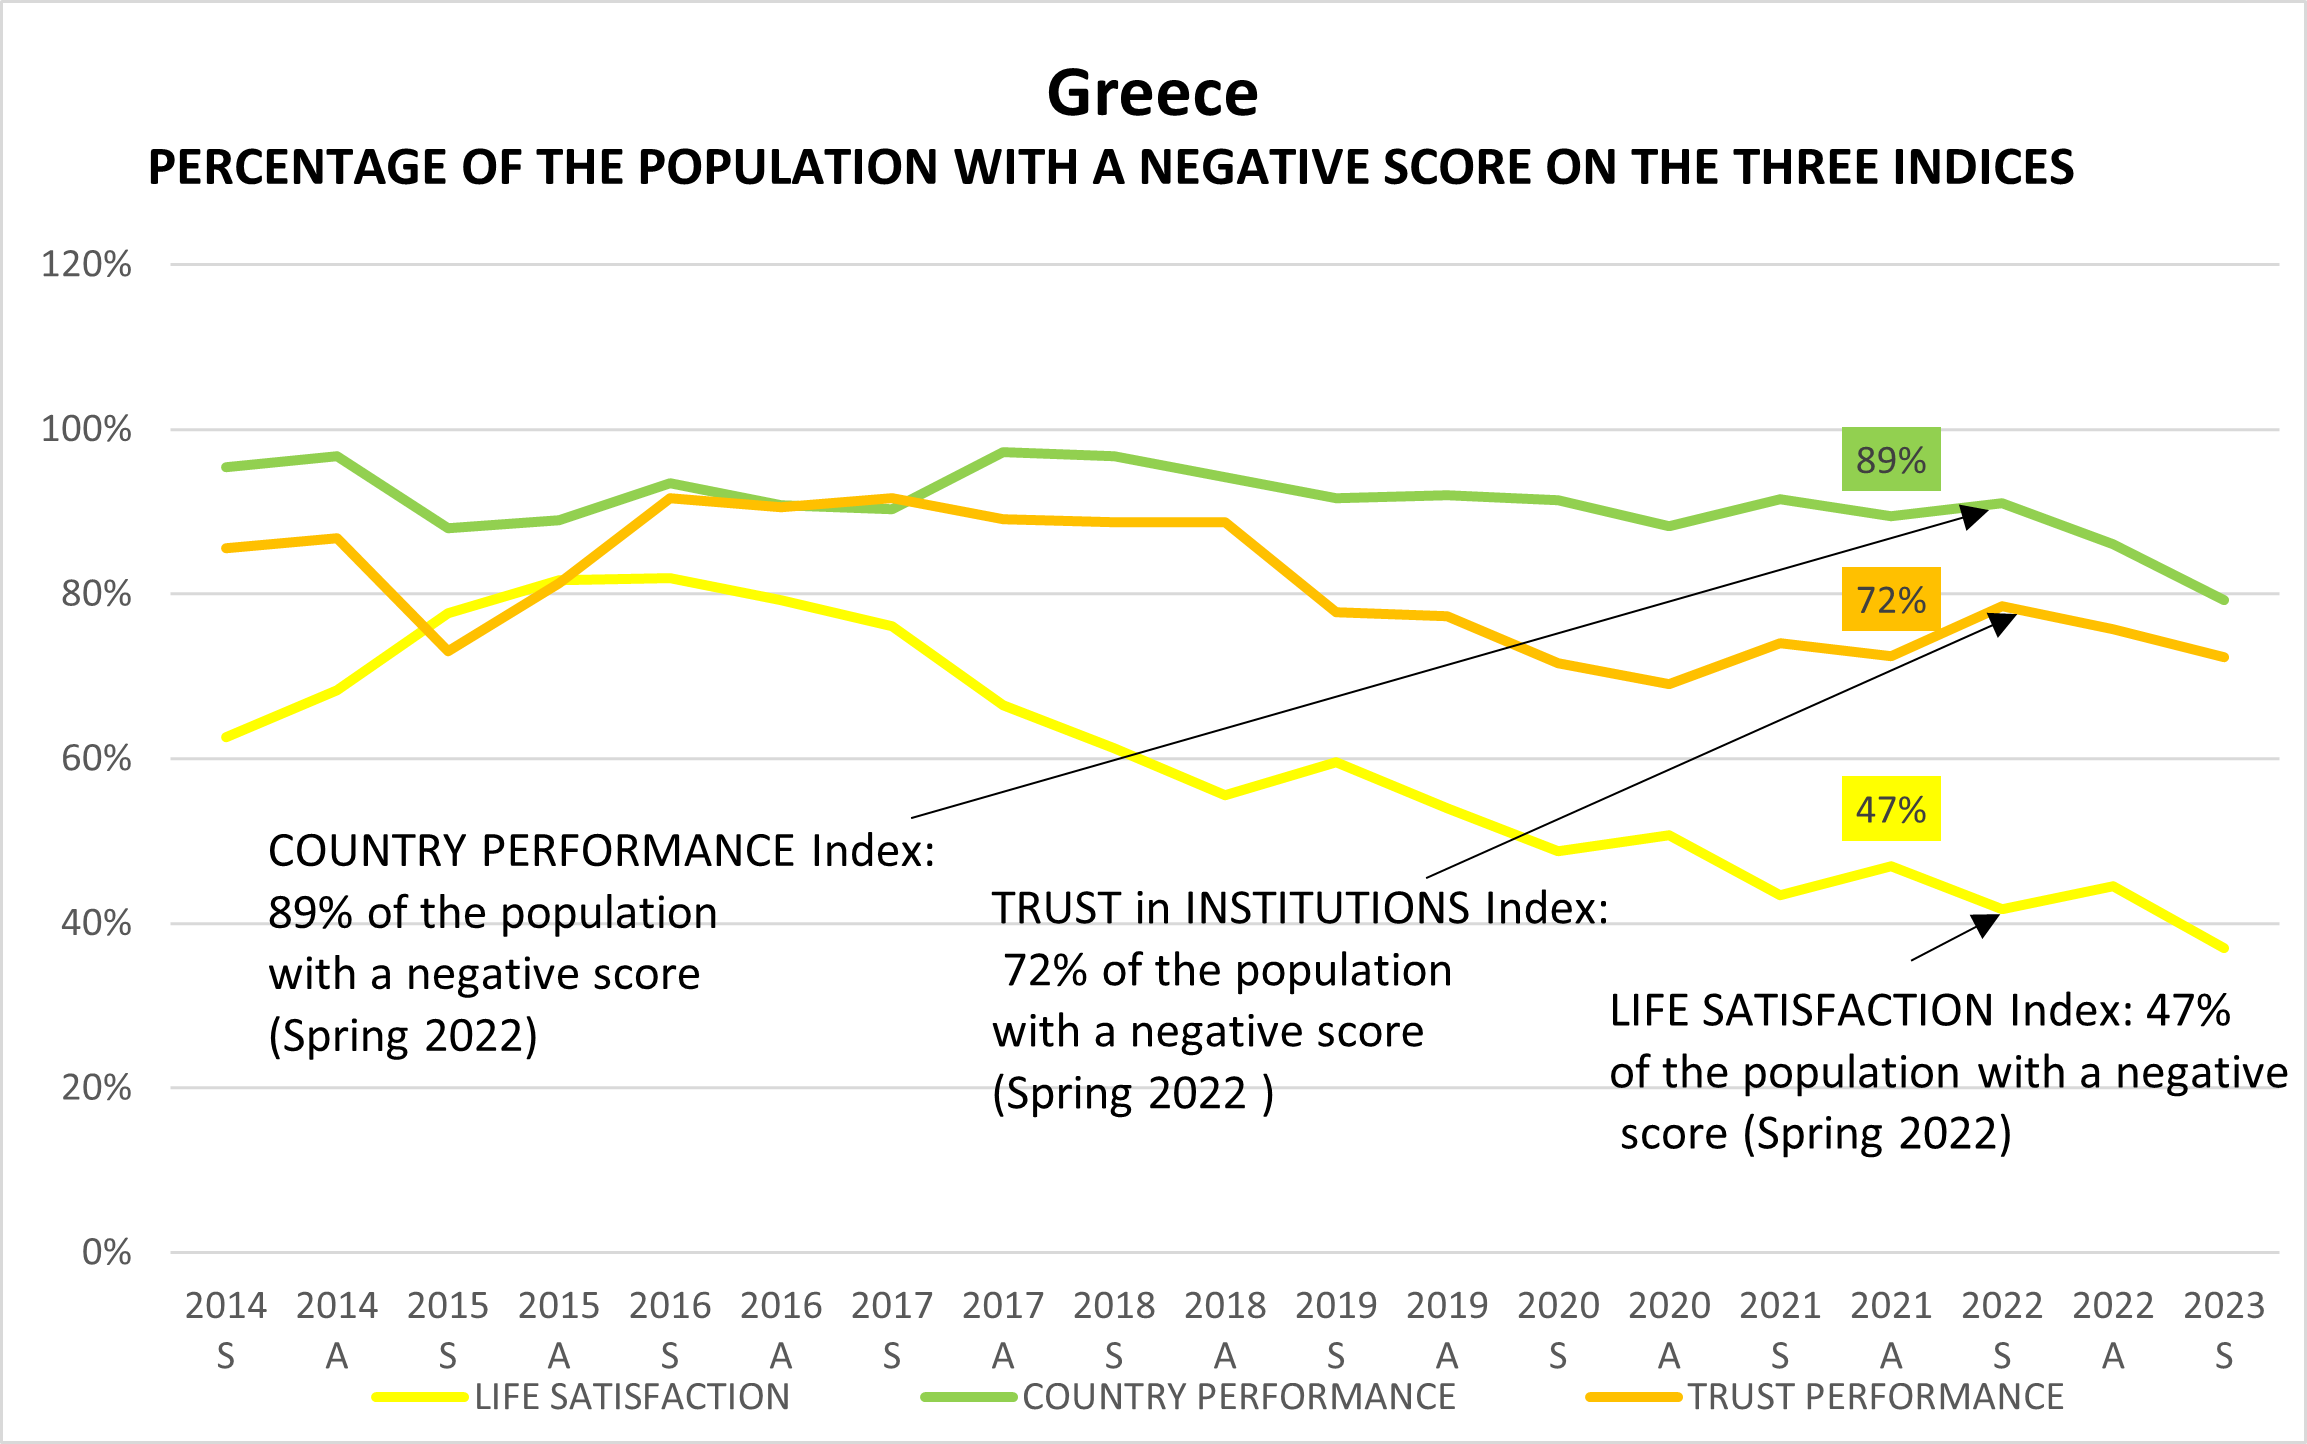
Applying the ‘Social Mood Indices’ methodology to Greece provides rather unsurprising results (Figure 8). After quite a substantial drop during the financial crisis, the ‘Life Satisfaction’ index reveals an upward trend. The other two indices also indicate some improvement over the years, but to a much lesser extent. However, as illustrated in Figure 9, the percentage of the Greek population with negative perceptions in all three indices is very high, especially with regard to the ‘country situation’ and ‘trust in institutions’ indices.
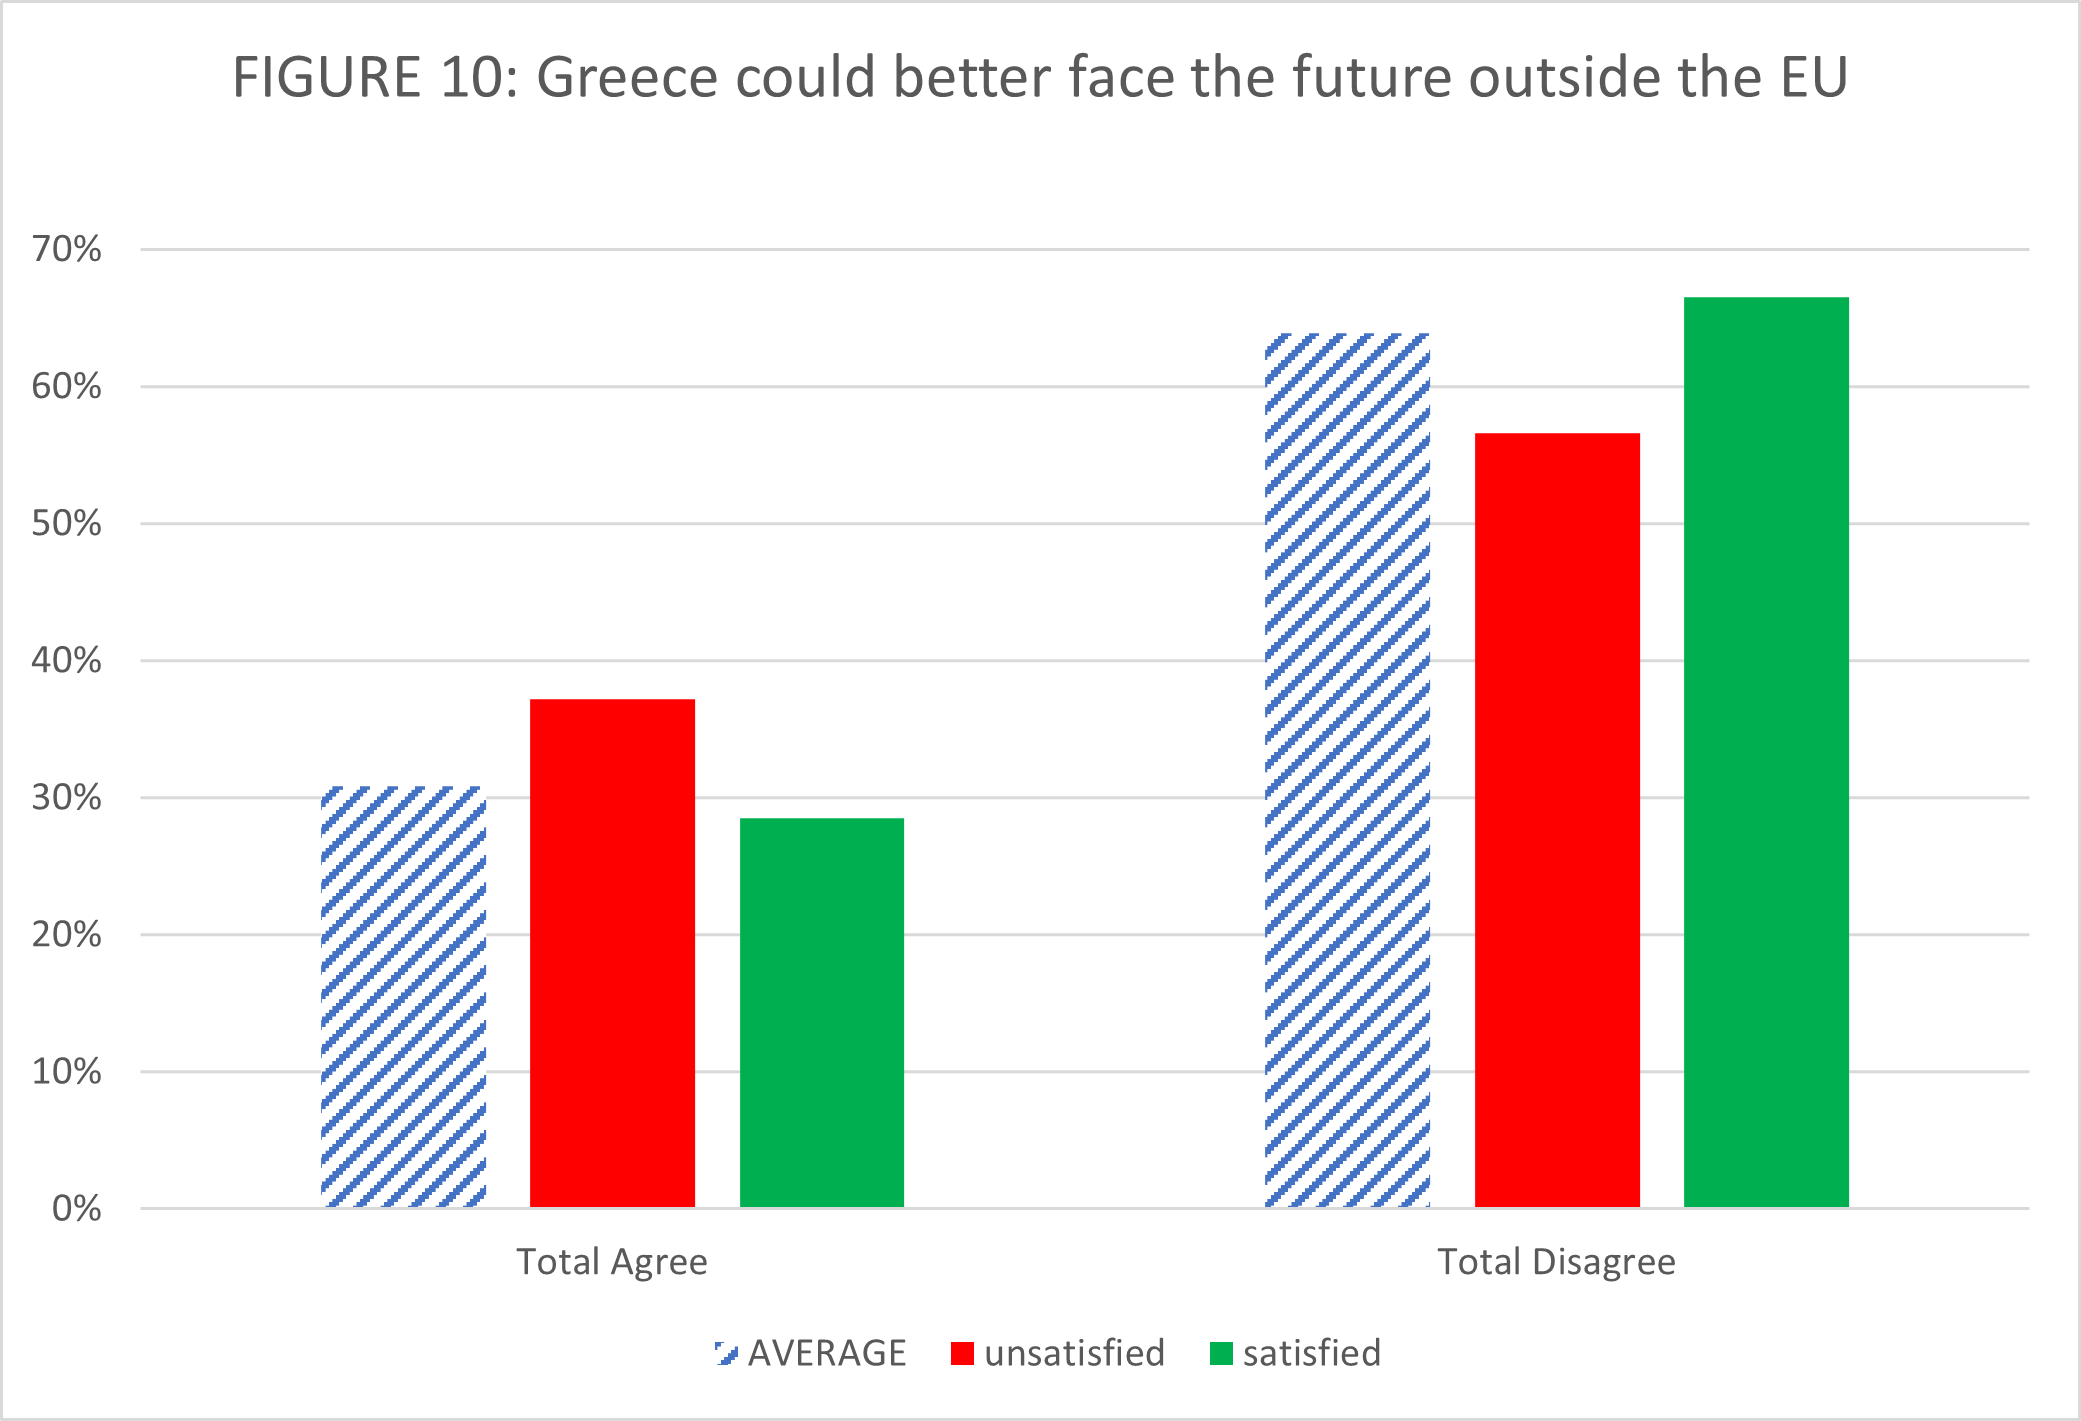
Breaking down the data gathered in the summer of 2023, 73% of the respondents are satisfied with their life as opposed to the remaining 27% who responded negatively. A significant majority of the population (64%) views Greece’s EU membership favourably. It is interesting to note that close to 60% of the ‘unsatisfied’ portion of the population support the country’s European perspective, irrespective of their own negative state-of-life perceptions and still consider remaining in the EU to be a better option (Figure 10).
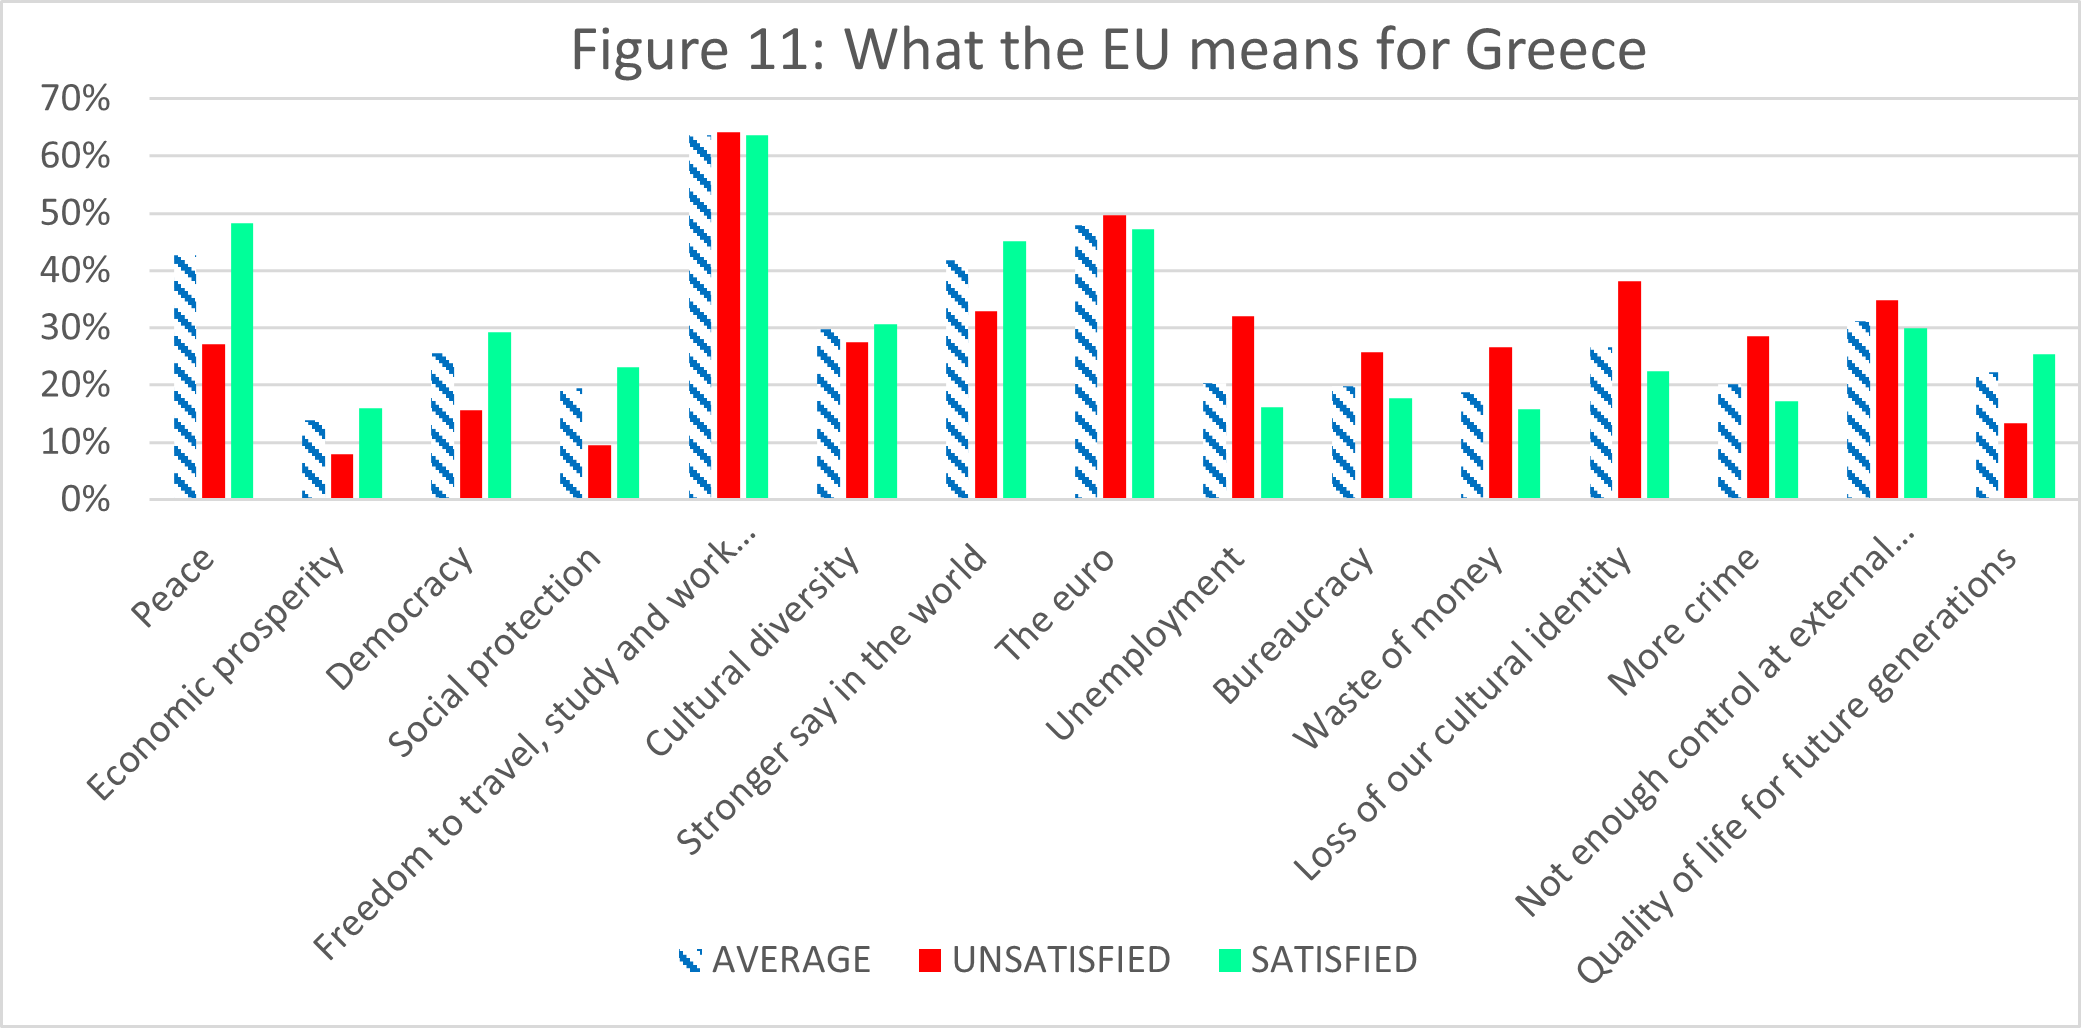
In the question on what the EU means for Greece, both the ‘satisfied’ and ‘unsatisfied’ groups of citizens highlight the importance of the freedom to travel, study and work in Europe (Figure 11). For the ‘dissatisfied’ group, however, the loss of cultural identity, lack of control at the country’s external borders, rising crime, and the economic underpinnings of integration (Euro, unemployment) figure very high on their lists. It is important to note the strong feelings of the ‘unsatisfied’ group vis-à-vis the “loss of cultural identity”, which ranks significantly higher compared to the overall results. This indicates that concerns over cultural preservation and identity are far more prominent among those who expressed dissatisfaction with the current state of affairs in the EU. These findings suggest a two-forked criticism of the EU based on both the–perceived–negative economic repercussions associated with the EU and the social/ cultural impact of the country’s membership on the fabric of society. In contrast, the ‘satisfied’ group of citizens emphasise the peace dividend of integration, democracy and social protection as well as the quality of life for future generations.
Conclusions
The objective of this paper has been to present a novel methodology for analysing Eurobarometer data by constructing three indices that group together the insights gleaned from several related questions: the ‘Life Satisfaction’ Index, ‘Country Performance’ Index, and ‘Trust in Institutions’ Index. This meta-analysis is helpful in providing a macro-perspective on social trends and the attitudes of European citizens vis-à-vis the European integration process and beyond. Besides the country-specific findings, the added value of this methodology stems from dividing the participants into two groups according to their life satisfaction and then examining the perceptions of these two groups regarding the EU and the other thematic issues that currently preoccupy European societies. This enables a departure from the rather simplistic approaches that conflated Euro-scepticism with social discontent. True, the ‘unsatisfied’ group do, more often than not, reject the idea of an ‘ever closer Union’. However, the group of citizens who identify themselves as ‘satisfied’ with their current life status also displays heterogeneity. A nuanced approach of this sort allows the EU to reach out to both groups more effectively, taking into consideration each group’s sensitivities and issues of concern, which are not the same across countries, age groups, genders and various other social characteristics and demographic factors. We therefore hope that the suggested methodology will lead to better-targeted communication strategies with messages tailor-made to engage specific groups of citizens more effectively in each member-state.
ANNEX I: Constructing the ‘Social Mood Indices’
The three indices use the following sets of questions:
Life Satisfaction Index
- The assessment of personal life
- The financial situation of the household
- Satisfaction with work
Country Performance Index
- The general situation in the country
- The economic situation in the country
- The employment situation in the country
Trust in Institutions Index
- Trust in government
- Trust in the National Parliament
- Trust in the Justice system
- Trust in political parties
- Perception of whether their opinion counts
For each index, we add the results of the responses, which range from -1 to +1. Then, for the sake of normalization, the result is adjusted to a number between -1 and +1. Let us look at an example for Index A, which consists of three questions. If the result for Question 1 is 1, the result for Question 2 is 1, and the result for Question 3 is -0.5, that produces a total of 1.5 on the scale of -3 to 3, which corresponds to 0.5 on the scale of -1 to +1.
The numerical values of the responses (-1 to +1) emerge as follows: the answers are scored from -1 to 0 if they are negative and from 0 to 1 if they are positive. Zero is assigned to responses that are neutral. These outcomes have been calibrated in such a way that they are equally weighted. Thus, -1 indicates a completely negative evaluation and +1 a completely positive opinion.
There are two types of answers to the questions used for the Indices. In the first type of question, there are four possible answers (‘I am very satisfied’: +1; ‘I am rather satisfied’: +0.5; ‘I am rather unsatisfied’: -0.5; and ‘I am very unsatisfied’: -1). No other answers are considered in the creation of the index. In the second type of question, there are two possible answers (‘I probably trust them’: +1; and ‘I probably don’t trust them’: -1).
In the graph below (which is for Greece, but is applicable to all member states), the vertical bars depict the results for each EUROBAROMETER. The yellow bars show the Life Satisfaction index, the orange the Trust in Institutions index, and the green the Country Performance index. The continuous line is the moving average that shows the trends. If the moving average is above the bar in the last year, it means that public opinion has declined.
The same information can be visualized in the following graph, which illustrates the percentage of the population with a negative score in the three Indices (the data is for Greece, once again, but the same information is available for all countries, enabling a comparative analysis).
[1] This working paper was presented at the 2023 Annual Conference of WAPOR (World Association for Public Opinion Research), 19-22 September, Salzburg, Austria. We would like to thank all the participants and discussants for their constructive comments and criticism.
[2] Some countries (including Denmark, the Netherlands, Luxembourg, Finland, Sweden, Ireland, Great Britain, and Malta) have a very small percentage of unsatisfied individuals. The percentages in these countries should therefore be treated with caution, due to the very small sample size.