EU’s budget is again at the center of the political discussions, with MEPs proposing new sources of EU revenue expressing concerns that otherwise the revenue will not be enough to repay the debt incurred for the Recovery Fund. The Commission has already proposed a first batch of new own resources in 2021.
Although the EU budget is small (just over 1% of EU GDP), its economic impact is important. Often, the size of the budget, the contributions of each member state, the composition of expenditures, and the sources of revenue become the subject of political debate.
The budget is primarily financed by the EU’s own resources. These concern mainly a proportion of each country’s gross national income (GNI) in line with the size of each economy, customs duties on imports from outside the EU and a (small) part of the value added tax collected by each EU country. Starting in 2021, a contribution based on the amount of non-recycled plastic packaging waste in each country is also added. Other revenue, include contributions from non-EU countries to certain programmes, interest on late payments and fines, as well as any surplus from the previous year
In recent decades, the total amount of the budget has been increasing significantly. In the first multiannual financial framework (1988-1992) the budget reached 276 billion euro, it was more than doubled in the next five years and in the following periods it continued to increase, but at a slower pace (For more information, see the relevant study by ELIAMEP). For the current period, EU has put together a comprehensive financial package of €1.8 trillion (in 2018 prices) coming from funds of the multiannual financial framework and NGEU.
Since 1988 (when multiannual financial frameworks were first adopted) Europe has changed massively. The enlargements (especially the one of 2004) increased the number of member states and the differences in the living standards between them. Now, the contributions of countries based on their gross national income are becoming an increasingly important source of budget revenue.
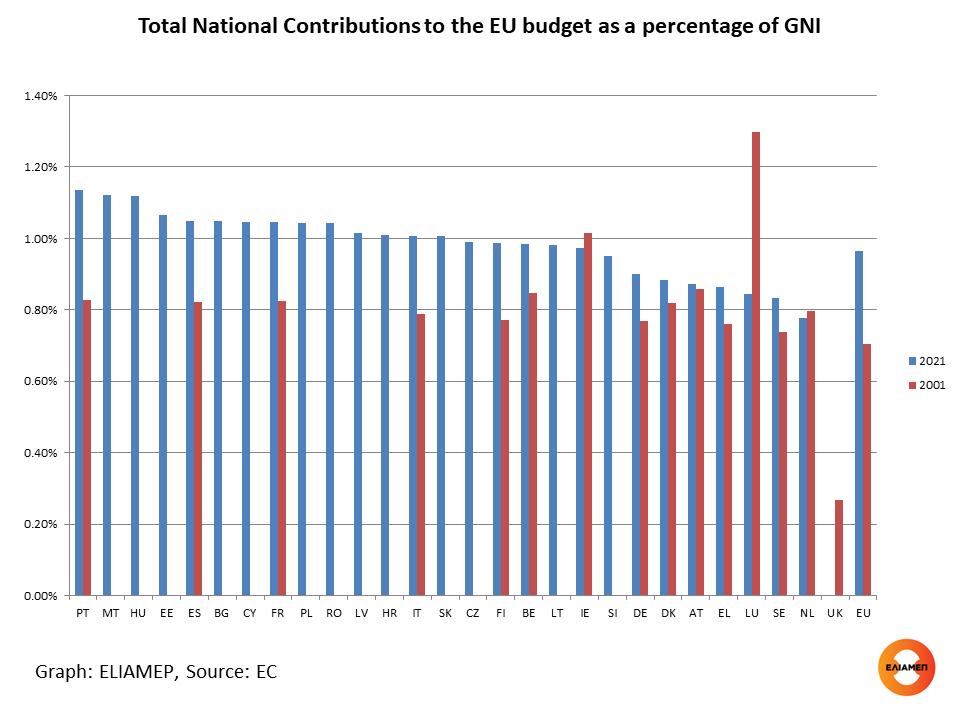
Specifically, in 2001 the total contributions of the member states were 66.1 billion euro (0.7% of the GNI of the EU-15), while in 2021 they reached 139.6 billion euro (0.96% of the GNI of the EU-27).
The countries with the highest level of development contribute more to EU’s budget. In 2021, Germany contributed 33.2 billion, France 26.4 billion, while Italy 18.1 billion.
By contrast, as a percentage of Gross National Income, each country ranks quite differently in terms of its national contribution to the EU budget. As shown in the graph, in 2021 Portugal was in first place (1.14%), followed by Malta and Hungary (1.12%), and Estonia (1.06%). Greece was in 24th place contributing 0.86% of GDP, while Germany (0.90%) was in the 21st. In the last (27th) place, was the Netherlands (0.78% of GNI).
However, what matters most is the net contribution of the member states, i.e. not only the how much each country contributes but also how much it receives from the budget. EU’s expenditure by member state will be the subject of the next In focus.


