


As the vaccination rates of the EU citizens increase and restrictive measures are being relaxed, there is optimism that economies are on the road to recovery. However, there are still no official data to confirm the pervasive optimism.
In order to explore the outlook for the economy, we use Google’s mobility trend data. These data contain sub-indicators such as traffic to retail sites or travel hubs. During the pandemic, Google’s mobility data fed model forecasts for the transmission of the virus itself, and were also used by the World Bank, central banks and international organisations for economic forecasts.
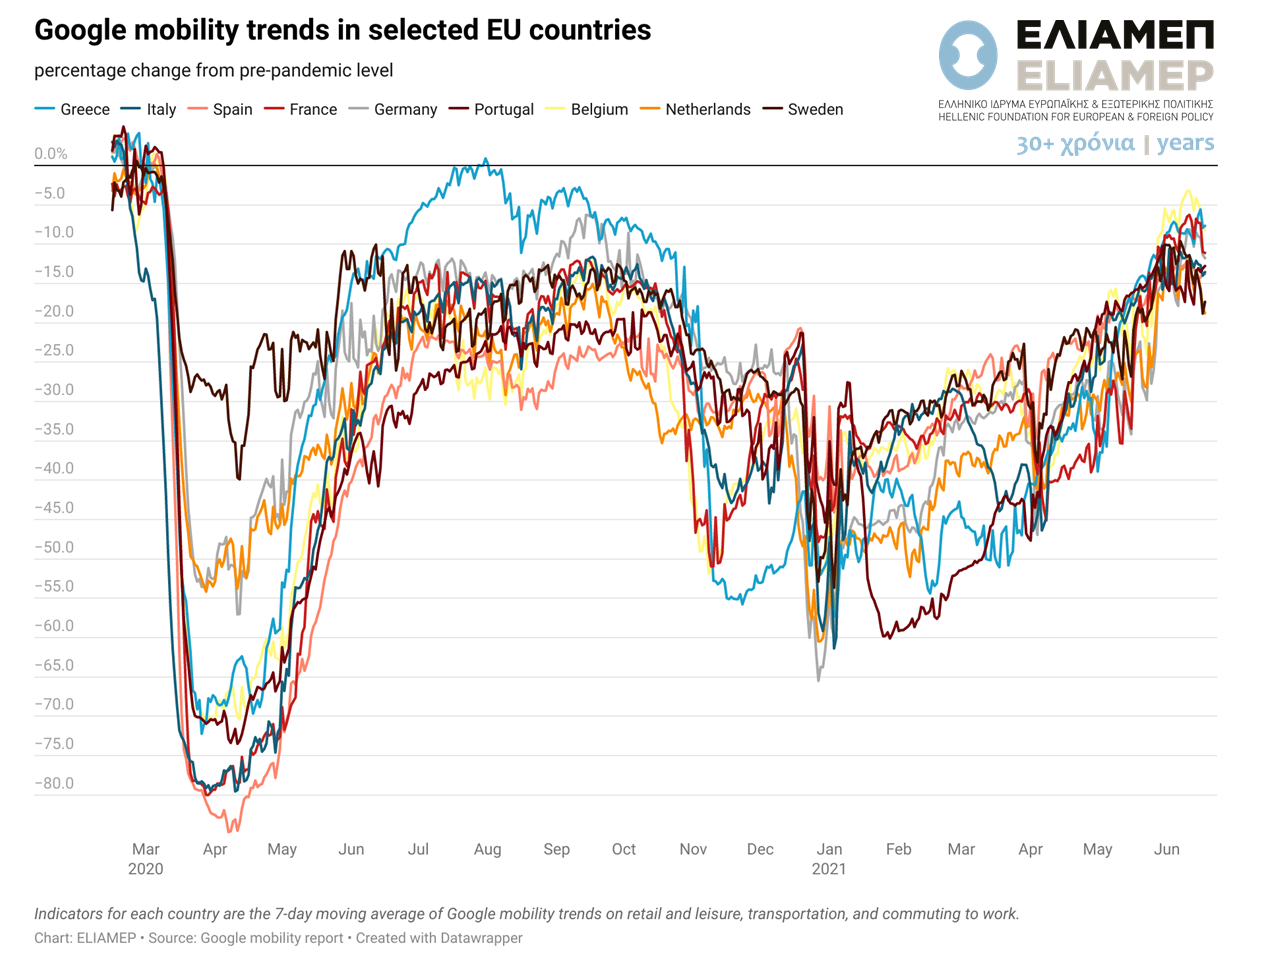
The graph shows the percentage change in mobility compared to the pre-covid era. The index is Google’s average of three sub-indices for the same period: retail and entertainment traffic, travel to transport hubs and workplace commuting.
The time series allow us to make some initial observations. Firstly, we notice that with the relaxation of restrictive measures and the advent of the summer months, travel has gradually increased. Although the same trend was observed last summer, we note that the increase this year is significantly higher than last June. Given that this year we have the vaccines against the virus at our disposal, the expectation is that this increase will not be followed by the fall depicted in the chart from September 2020 onwards, when the second wave of the pandemic led to new measures to limit mobility.
Google’s mobility data allow us to draw a first picture of economic activity before official data are available. Although the composite mobility index does not yet confirm a return to pre-pandemic mobility rates, the picture we have shows that both Greece and the other economies have entered on an upward trajectory, achieving greater mobility compared to the same period last year.