


The Mediterranean is of multifaceted importance for the global economy, as it is one of the most highly valued seas globally. However, the region’s growth and economic integration path has often been obstructed by political upheavals and conflicts. This paper focuses on key features of the current regional dynamics in trade, investments and energy as sources of growth in the Mediterranean, with a view to assessing where the region stands today. The Mediterranean’s regional economic linkages manifest two dominant features: on the one hand, there is the marked heterogeneity of the countries’ performance in foreign trade, investment flows and energy (oil and gas) potential; on the other hand, there is the strong north-south element that shapes all intra-regional flows. These features indicate that, despite weak integration at a regional level, opportunities exist to strengthen intra-regional links as the Mediterranean further integrates into the global economy and benefits from long-standing multilateral and cooperative structures across the region.
You may find the Policy paper by Panagiota Manoli, Assistant Professor in Political Economy of International Relations, University of the Peloponnese and Research Fellow, ELIAMEP, in pdf here.
Acknowledgement: The author would like to thank Elisavet Plagianni, George Moschopoulos and George Verdi for their research assistance.
Introduction
At the centre of a relatively volatile regional context, the Mediterranean dominates the geostrategic environment of Europe, North Africa and the Middle East. From the shores of Asia to the east to the Atlantic Ocean to the west, separating Europe from Africa and connected to the marine basins of the Sea of Marmara and the Black Sea, the Mediterranean Sea represents a valuable asset locally and globally. Its shores witnessed the rise and fall of civilizations which contested its coastal areas and resources to gain control of the sea. Down the millennia, the Mediterranean has encouraged trade and cooperation, regulated climate, provided nutrients and propelled economic growth.
Today, the region is characterized by the strong diversity of its coastal countries; institutional and political heterogeneity, uneven economic development, wealth inequalities and a complex security environment. The differences fall largely into a north-south divide, where the sea’s northern shores are advanced, stable EU-integrated societies, but the southern shores suffer poor socio-economic indicators and instability.
“Economic inter-dependence is expected to have a positive impact, bridging the development and security gap between Mediterranean northern and southern shores.”
Economic interdependence is expected to have a positive impact, bridging the development and security gap between the Mediterranean’s northern and southern shores. Bridging this gap has been pursued institutionally through inter alia the Barcelona Process, the Union for the Mediterranean (UfM), and targeted programmes such as the ENPI CBC MED Programme which was launched in 2007. When it was launched in 1995, the Barcelona Process was an ambitious, ground-breaking project which sought to foster cooperation between the European Union (EU) and the Mediterranean countries (MED), including Arab states and Israel. Today, the original initiative has developed into the Union for the Mediterranean (UfM) with a revamped project-oriented agenda which has expanded to cover 42 states. The overall political and economic environment in the Mediterranean has, however, blocked smooth progress towards cooperation. Over the last decade, the Mediterranean area has been shaken by events such as the Arab Uprisings, the 2008 global financial crisis, the wars in Libya and Syria, a refugee crisis and terrorist acts which undermine the region’s economic development, political stability and social cohesion.
This paper looks into key features of the current regional dynamics in trade, investments and energy as sources of growth. The region covered consists of 21 littoral states[1] with a population of 500 million, or 7% of the world’s population, and regional GDP representing approximately 10% of world GDP (Graph 1).
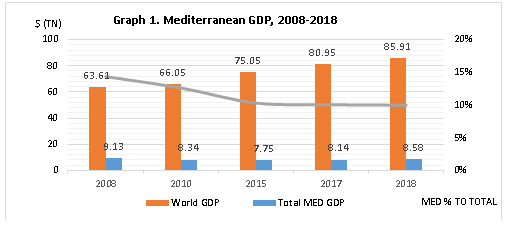
Note: Included countries: Albania, Algeria, Bosnia and Herzegovina, Croatia, Cyprus, Egypt, France, Greece, Israel, Italy, Jordan, Lebanon, Libya, Malta, Monaco, Montenegro, Morocco, Slovenia, Spain, Syria (data availability limited to 2007), Tunisia, and Turkey.
Source: World Development Indicators, World Bank, last updated: 10 October 2020.
A seaborne regional economy
The Mediterranean is of multifaceted importance for the global economy, as it is one of the most highly valued seas globally. A major contributor to regional GDP, the Mediterranean sea currently generates massive economic value through its natural ecosystems and maritime resources; key economic sectors born of the sea include tourism, fisheries and aquaculture, transport and logistics, shipbuilding and recycling, energy, bioprospecting and deep-sea mining. In 2017 alone, ocean-related activities in the Mediterranean generated US$450 billion, representing approximately 20% of the global annual gross marine product (GMP) in an area which makes up only 1% of the world’s ocean. Italy made the largest contribution to the Mediterranean GMP, followed by Spain, France and Turkey.[2]
With 92% of the region’s GMP deriving from coastal (valued at around US$300 billion annually) and marine tourism (valued at around US$110 billion annually),[3] it is safe to say that tourism continues to drive economic growth in the Mediterranean. According to the WTTC (2017), 16% of the Mediterranean population was employed in the tourism sector in 2016 either directly – by hotels, travel agents, transportation services, food and leisure industries directly supported by tourists — or indirectly —travel & tourism investment spending, government spending and supplier purchases. Fisheries, including aquaculture, rank third in socio-economic value after tourism and transport in the Mediterranean.[4] Due to its strategic position, the Mediterranean has always been a vibrant economic space, enabling the transport of products, energy and people.
The region is important for global trade, as trade flows within the region account for 25% of all international seaborne trade;[5] to facilitate this, there are approximately 600 ports of varying sizes on the Mediterranean’s coasts[6]. The transportation of goods has witnessed enormous growth over the last two decades, and, according to the International Transport Outlook 2019, the demand for global freight will triple between 2015 and 2050, with three-quarters being carried aboard ships.[7] Overall, the maritime transport and trade industry generates around 550,000 jobs for local populations and accounts for approximately 20%-40% of GDP for most Mediterranean countries.[8]
In terms of short sea shipping (of goods), the Mediterranean is the most important sea region of all for the EU, as 31% of the total EU short sea shipping tonnage for all sea regions in 2018 went through the Mediterranean (followed by the North Sea and the Baltic, which accounted for 23% and 21% of the total EU short shipping tonnages, respectively).[9] Today, the Mediterranean is integrated into the China-led Belt and Road Initiative (BRI), which is primarily a massive infrastructural plan aimed at supporting Chinese exports to European markets. BRI maritime routes includes ports on the north coast of the Mediterranean (Piraeus in Greece) and in Southern Mediterranean countries, including Egypt’s canal ports (Ismailia and Port Said). In addition to investments in Mediterranean ports, the BRI includes Chinese cooperation agreements in other sectors including renewable energy, water, chemicals, and agriculture (as in the case of Israel).
“Despite the strategic location of the Mediterranean for global trade, the region’s developmental path has been rocky, undermining intra-regional dynamics.”
Despite the strategic location of the Mediterranean for global trade, the region’s developmental path has been rocky, undermining intra-regional dynamics. The Mediterranean region’s GDP per capita, (approximately US$26,438 PPP) is significantly higher than the world average (US$17,673 PPP). However, the region is divided into two strikingly different subgroups: the EU member states (north coast) enjoy a GDP per capita (US$40,597 PPP) that is twice the world average, while the non-EU Mediterranean countries have a GDP that is approximately the world average (US$18,832 PPP); if Israel is excluded, however, their GDP per capita falls below the world average (Graph 2).
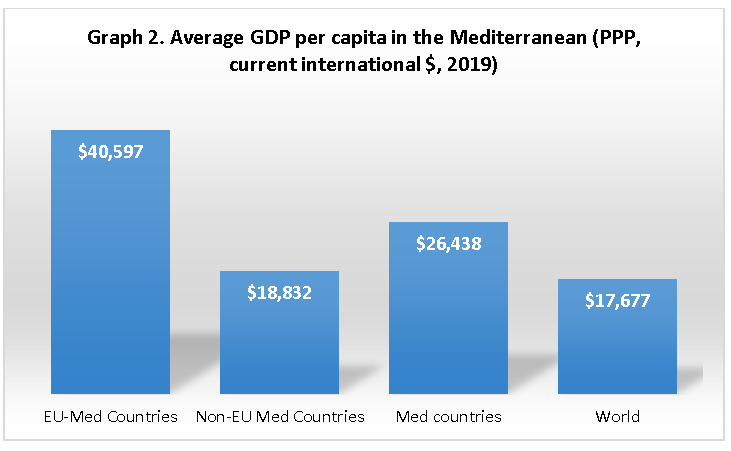
Source: Based on World Development Indicators (World Bank) and IMF data, last updated 15 October 2020.
Note: Palestine (2018), Syria (2010).
“…regional GDP over the last decade marked a decline in the percentage of global GDP accounted for by the Mediterranean from 14.4% in 2008 to 10% in 2018.”
Changes in regional GDP over the last decade marked a decline in the percentage of global GDP accounted for by the Mediterranean from 14.4% in 2008 to 10% in 2018 (Graph 1). Social unrest and political instability (Lebanon), war (Syria and Libya), and the Eurozone crisis (Greece, Cyprus and Spain) have been major hindrances to regional growth, along with the impact of lower energy prices, which has affected North African oil and gas exports. Furthermore, the shock of the COVID-19 pandemic in 2020 has had a profound effect on several aspects of every Mediterranean economy. According to IMF estimates, EU Mediterranean countries are projected to contract on average by -7.59% and non-EU Mediterranean countries by -9.07% in 2020, which is worse than the forecast for the world average (-3.41%).[10]
“According to IMF estimates, EU Mediterranean countries are projected to contract on average by -7.59% and non-EU Mediterranean countries by -9.07% in 2020, which is worse than the forecast for the world average (-3.41%).”
Regional trade: trends and linkages
Trade is considered to be a key driver of economic development and regional cooperation, as countries which are well-integrated into international trade networks tend to grow more. In the case of the Mediterranean, littoral countries have a heterogeneous foreign trade profile, while most of them are weakly linked to global trade networks and the global value chain. Mediterranean economies are open economies, with exports of goods and services accounting for 30-40% of GDP for most, though the percentages are much higher for some small Mediterranean economies, such as Malta with 144%, Slovenia with 85%, and Cyprus with 64%.[11]
“The overall value of Mediterranean exports to the rest of the world (including intra-Med flows) is about US$1.9 trillion (in 2019). That accounts for 10.3% of world exports.”
The value of foreign (merchandized) trade varies significantly between Mediterranean countries. France and Italy are top traders with foreign trade worth more than US$1 trillion each, while Spain comes third with exports valued at US$700 billion (in 2019). The smaller traders account for a fraction of that value, with states such as Montenegro and Palestine trading well below US$10 billion each.[12] The overall value of Mediterranean exports to the rest of the world (including intra-Med flows) is about US$1.9 trillion (in 2019) which accounts for 10.3% of world exports.
The majority of foreign trade is conducted with countries beyond the Mediterranean, and with other European Union (EU) economies in particular. In terms of exports, the EU attracts more than half of Egyptian, Algerian, Libyan, Moroccan and Tunisian exports. However, this dependency on European markets is arguably due to energy exports. Germany (US$200 billion), the United States (US$120 billion) and the UK (US$100 billion) were the Mediterranean’s primary export destinations in 2018.[13] Mediterranean imports from the EU are more diverse. While Morocco, Algeria and Tunisia reduced their dependence on EU products, Libya and Egypt have significantly increased their imports of EU products in recent years. Germany is also the biggest exporter to Mediterranean countries (US$260 billion), with China a close second (US$180 billion) in 2018. Other key exporters include the USA, Belgium and the Netherlands.[14]
Intra-Med trade flows
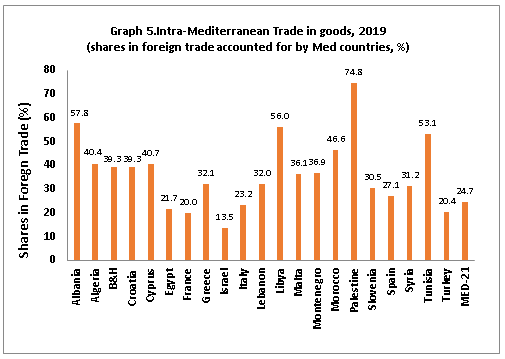
The overall value of intra-Mediterranean (merchandized) trade was about US$1.02 trillion in 2019, representing less than a third of the countries’ foreign trade. Regional economic integration remains limited, particularly between Southern Mediterranean countries. Which countries are most dependent on intra-regional trade? Graph 3 shows that only Palestine conducts more than 70% of its foreign trade with other Mediterranean partners, followed by Albania and Libya, which conduct more than 50% of their foreign trade in the Mediterranean. The countries least dependent on intra-regional trade are Israel (14%), France (20%), and Turkey (20%). However, trade between Southern Mediterranean countries accounts for only a small fraction of their foreign trade (5.9% in exports and 5.1% in imports), revealing one of the lowest levels of regional economic integration in the world.[15]
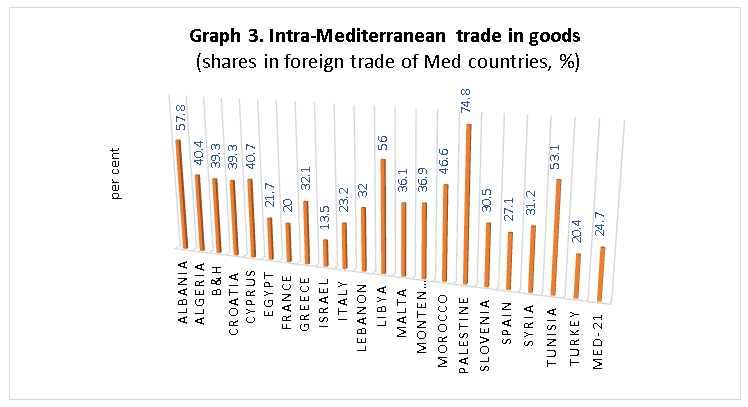
Note: Syria (2010), Algeria (2017), Albania, Lebanon, Libya, Montenegro, Palestine (2018). B&H, Croatia, Egypt, France, Greece, Israel, Italy, Malta, Morocco, Spain, Tunisia, Turkey (2019).
Source: UN Comtrade statistics.
“The aggregate exports of the three largest Mediterranean economies (Italy, France and Spain) to all Mediterranean partners are US$ 349 billion.”
There is considerable variation in the value of goods exported by Mediterranean countries. The value of the export trade in goods within the Mediterranean region ranges from US$107 million for Montenegro to US$129 billion for Italy. The aggregate exports of the three largest Mediterranean economies (Italy, France and Spain) to all Mediterranean partners are US$ 349 billion, accounting for 66% of the total value of intra-Med exports of goods. Thus, Italy (US$129 billion), France (US$116 billion) and Spain (US$103 billion) are the top three exporters in the intra-Med trade in goods. It comes as no surprise that they are also each other’s most important Mediterranean trade partner, with combined exports accounting for 45.7% of total intra-Med exports. This powerful triangle of trade linkages between these three EU countries largely defines intra-Med flows. However, none of the three is highly dependent on the Mediterranean, as less than a third of their exports go to the region as a whole. Which Mediterranean countries export least to the region? In terms of the volume of exports to the rest of the Mediterranean, Montenegro is in the last place (US$ 107 million), with Lebanon (US$ 689 million) and Cyprus (US$ 999 million) close behind (Graph 4).
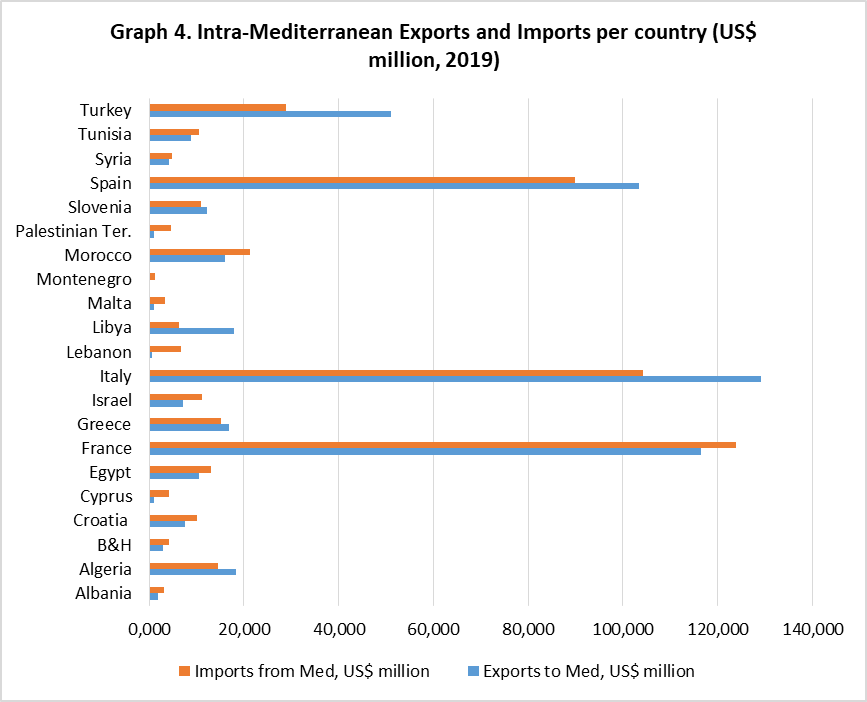
Note: Syria (2010), Algeria (2017), Albania, Lebanon, Libya, Montenegro, Palestine (2018). B&H, Croatia, Egypt, France, Greece, Israel, Italy, Malta, Morocco, Spain, Tunisia, Turkey (2019).
Source: UN Comtrade statistics.
“For Turkey, one of the largest economies in the region and a G20 member, its most important trading partners in the Mediterranean are also EU Mediterranean economies.”
For Turkey, one of the largest economies in the region and a G20 member, its most important trading partners in the Mediterranean are also EU Mediterranean economies, namely Italy (representing 24% of Turkey’s total trade with Mediterranean countries), France (18.4%) and Spain (15.7%). For all three of these countries, the most extensively imported product from Turkey are vehicles other than railway or tramway rolling-stock. Other important trade partners of Turkey include Israel (representing 7.6% of Turkey’s total trade with Mediterranean countries) and Egypt (6.8%).[16]
“In terms of value, intra-Mediterranean trade is dominated by the exchange of energy.”
What do Mediterranean countries trade between them? Countries in the Mediterranean are rich in natural resources, agricultural and manufactured goods, and have long-standing trading relations. In terms of value, intra-Mediterranean trade is dominated by the exchange of energy. Crude oil is traded from most North African countries and Syria, refined petroleum products are traded from Croatia, Cyprus, Greece and Malta to the majority of EU countries and Egypt, while electrical energy constitutes the main export of Bosnia and Herzegovina.[17] Moreover, the rich Mediterranean soil encourages the exchange of natural resources including aluminium from Montenegro, precious metals, stones and pearls from Israel, and gold from Turkey—a leading export for that country. Non-energy commodities traded within the Mediterranean region include medicaments from Italy and Slovenia, aircraft-related products from France, and vehicles from Spain and Morocco—with Albania and Libya being major regional importers.
Note: Syria (2010), Algeria (2017), Albania, Lebanon, Libya, Montenegro, Palestine (year 2018).
Source: UN Comtrade statistics.
Foreign Direct Investment
“…the region has maintained its place on the international capital flows map, despite the adverse conditions stemming from financial and economic crises, political upheavals, and security instability.”
Foreign direct investment (FDI) is a key driver of growth for all Mediterranean countries, not only as a source of capital accumulation but also as a trigger for production, the transfer of technology and knowledge, and integration into global value chains. The performance of FDI in the Mediterranean region over the last decade has been mixed (Appendix 2). On the one hand, the region has maintained its place on the international capital flows map, despite the adverse conditions stemming from financial and economic crises, political upheavals, and security instability. In 2019, as a region, the Mediterranean attracted 10.6% of global FDI and a volume of approximately US$172.5 billion (Graph 6).
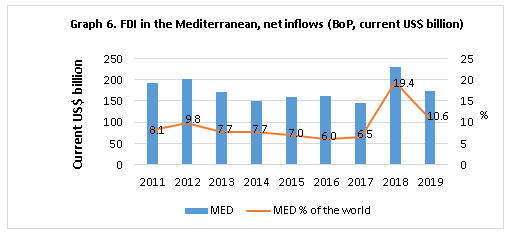
Data: World Development Indicators database, World Bank. Last updated 15 October 2020.
Note: Palestine is not included.
“On the other hand, this level of FDI is below the region’s potential, given the size of its local economies, population growth, and proximity to major markets.”
On the other hand, this level of FDI is below the region’s potential, given the size of local economies, population growth, and proximity to major markets. Furthermore, in 2019, the non-EU Mediterranean countries, which are net recipients of FDI, attracted only 27% of net inward FDI in the Mediterranean region, or 2.7% of world FDI—a sum of approximately US$ 44.4 billion (Graph 7).
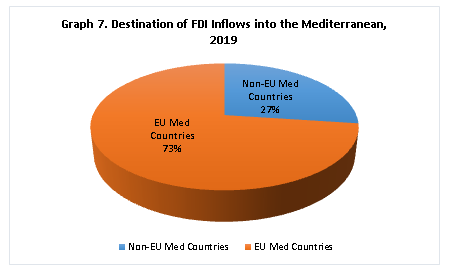
Data: World Development Indicators database, World Bank. Last updated 15 October 2020.
Note: Palestine and Syria not included.
It is noteworthy that while FDI flows into the non-EU Mediterranean are small when compared to global standards, the ratio of FDI to GDP is higher than the world average (1.8% of GDP), indicating the significance of FDI to their economic growth (Graph 8).[18]
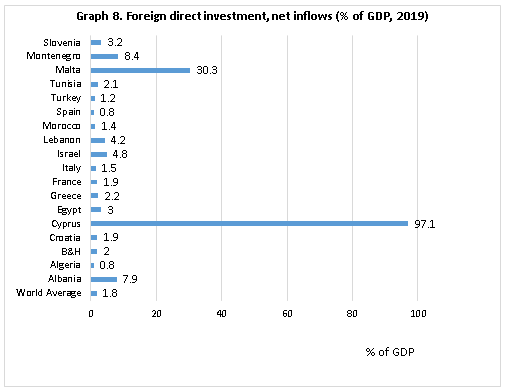
Source: Based on World Development Indicators database, World Bank. Last updated 15 October 2020.
Note: Palestine and Syria not included.
In the last decade, the largest net inflow among non-EU Mediterranean countries was recorded by Israel, resulting from inflows of US$19 billion and outflows of US$8.5 billion in 2019. Egypt is the second largest recipient (and the top FDI recipient in the whole of Africa), followed by Turkey (Appendix 2). In contrast, although a decade ago all EU Mediterranean countries —with the exception of Malta— were net investors, the picture has become rather more diverse since 2011, as the Eurozone crisis impacted severely on their economies. Only France has remained a consistent net investor since 2011 (except for 2013), while Spain and Italy were net investors for several years as well (Appendix 3).[19]
“The Mediterranean region ranks low as a destination for European FDI, despite its geographical proximity to, and long historical links with, EU members.”
The Mediterranean region ranks low as a destination for European FDI, despite its geographical proximity to, and long historical links with, EU members. Approximately 2.4% of extra-EU28 (EU plus UK) foreign direct investment in 2017 was in the Mediterranean, with Turkey (which received 0.9% of extra-EU FDI), Egypt (0.6%), Israel (0.4%) and Morocco (0.2%) as the top four recipients of European FDI.[20]
Note: Tunisia and Albania (year 2019). Source: Data based on OECD. Stat and national statistics.[21]
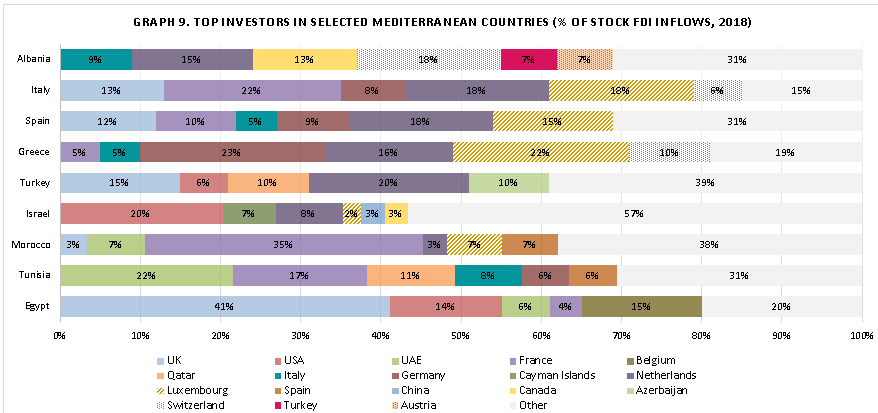
“Even though the geographical sources of FDI to Mediterranean countries are becoming more diversified the largest investment shares are still held by investors from the EU, UK and USA.”
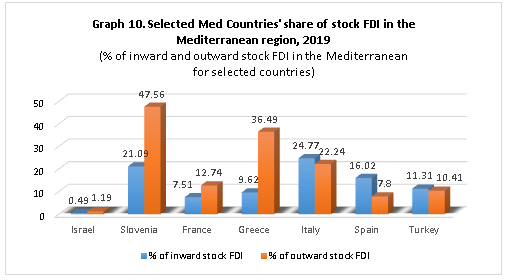
Even though the geographical sources of FDI to Mediterranean countries are becoming more diversified, the largest investment shares are still held by investors from the EU, UK and USA (Graph 9). What are the intra-Mediterranean dynamics in terms of stock FDI? Approximately 13% of FDI originating from France, one of the countries that invests most in the Mediterranean, is directed to the region and primarily to Italy, which holds 6.9% of French stock FDI in the region.[22] In terms of stock FDI, France is the top investor in Italy and Morocco and the second in Tunisia, while it is among the top five investors in Greece and Spain (Graph 9). The Mediterranean hosts 22% of Italian stock FDI outflows, most of which is directed to Spain (32.6%) and France (28.4%). Of the non-EU Mediterranean countries, Algeria alone accounts for a notable 9.3% of Italian stock FDI in the Mediterranean. It is interesting to note that, according to the latest OECD statistics from 2019, the Mediterranean is not a significant destination of FDI originating from Spain, as only 7.8% of Spain’s stock FDI outflows are into the region, of which nearly half (46.8%) go to France. For smaller economies such as Slovenia, the Mediterranean is a significant FDI destination (47% of Slovenian stock FDI abroad is in the region, see Graph 10) however, such high percentages often reflect strong bilateral linkages (indicatively just one country, Croatia, holds 32% of Slovenian stock FDI abroad). Israel has somewhat diversified geographical sources of inward stock FDI and, interestingly, there is no Mediterranean nation among the top six investors in the country.
Source: Based on OECD. Stat.
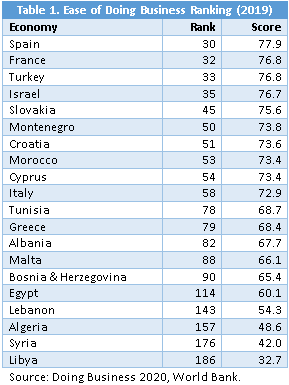
Despite the strong potential (natural resources, domestic market, geographical vicinity, institutional links), foreign direct investment linkages between the Mediterranean countries remain weak. Beyond the often unattractive investment framework (the business climate remains poor in several countries, with Libya ranking 186th, Syria 176th, Algeria 157th and Lebanon 143rd out of 190 countries in the World Bank’s Doing Business 2020 ranking, see Table 1), one of the key hindrances is the security context (as in Syria and Libya), which has been deteriorating in recent years.
Regional Energy Flows
“It is not only intra-regional trade that is dominated by energy products […] the Mediterranean coastline and waters facilitate worldwide energy consumption.”
It is not only intra-regional trade that is dominated by energy products, as data from the Mediterranean Growth Initiative indicate;[23] as a hub for the production and transportation of energy globally, the Mediterranean’s coastline and waters facilitate worldwide energy consumption while also contributing to the development of local economies. Rich natural resources in the Middle East and North Africa (ΜΕΝΑ), oil and natural gas pipelines transferring resources to Europe and North America along the southern Mediterranean coast, as well as the ongoing search for new oil and gas fields in the Eastern Mediterranean only underscore the significance of the Mediterranean basin. At the same time, the Mediterranean constitutes a major energy market in its own right. Thus, while over 9% of the world’s electricity is consumed in the region, production falls short of that. France, Spain, Turkey, Egypt and Algeria are all net electricity exporters, while Italy, Croatia and Montenegro are net importers. Petroleum products top the exports of Italy, Algeria and Greece (Italy and Greece export refined oil products), while Algeria is also a major exporter of natural gas. The region imports around 13% of world oil and exports around 10%.[24]
The Mediterranean is important as an energy supplier primarily to the South European countries (Italy, Spain and France). According to Eurostat data, Algerian natural gas accounts for 12.1% of EU imports of natural gas (in 2019), being the third largest –though declining– supplier of gas to the EU, while Libya provides just 1.2%. According to 2018 data,[25] Algeria was the top natural gas supplier to Spain (accounting for 42% of its total natural gas imports), and provided 10% of LNG imports. It was also the 4th largest gas supplier to France (also supplying 33% of France’s LNG imports) and Turkey (40.2% of LNG imports), and the 2nd largest natural gas supplier to Italy and Greece. For Italy in particular, which is the second-largest natural gas importer in Europe, imports from Algeria accounted for 26.5% and from Libya accounted for 6.6% of natural gas imports. As a transit country, Turkey was Greece’s 3rd largest natural gas supplier.[26]
In terms of petroleum, Syria was a minor supplier to the EU, which imported 1.35% of its petroleum from Syria in 2010 prior to the EU sanctions on the energy trade imposed in September 2011. Since then, the energy trade between EU countries and Syria has stalled. In addition to Germany, which was the top destination country (accounting for 32% of Syrian oil exports), Italy, France and Spain were also key destination markets, receiving 31%, 11% and 5% of Syrian oil exports, respectively. Algeria also provides 3.2% of the EU’s imports of crude oil.[27] Indeed, Europe is the main export destination for Algerian crude oil (absorbing 57% of its total exports), with France and the UK being the largest export destination countries in terms of volume (92,000 b/d and 82,000 b/d respectively).[28] Libya, which is home to Africa’s largest crude oil reserves and is a member of the Organization of the Petroleum Exporting Countries (OPEC) provided close to 10% of total EU oil imports before the 2011 civil war, but this had dropped to 6.1% by 2018.[29] Italy and Spain were the major destinations for Libyan oil (and natural gas) exports via the Greenstream pipeline[30] and liquefied natural gas (LNG) plants, which was severely damaged during the civil war. To date, production remains disrupted, as the political environment–along with Libya’s loading ports, oil fields, and pipelines–remains insecure.
Egypt, Africa’s principal non-OPEC oil producer, has rich oil and natural gas resources, with oil reserves estimated at 3.3 billion barrels, natural gas at 77.2 trillion cubic feet (tcf); overall, hydrocarbon production accounted for 13.6% of the country’s GDP in 2018.[31] Substantial revenues also originate from the Suez Canal and the Suez-Mediterranean (SUMED) Pipeline operation, shipping oil and liquefied natural gas (LNG) from North Africa through the Mediterranean to Asia. However, the country has witnessed a reversal since the mid-2000s, having been transformed from a key producer and exporter of oil and natural gas to a net oil and gas importer, as domestic supplies have fallen short of demand.
“Energy trade is arguably the most important economic link in the Mediterranean region. Mineral fuels top Mediterranean exports (US$ 221 billion) and are the third top imported commodity (US$ 133 billion) in terms of value.”
Energy trade is arguably the most important economic link in the Mediterranean region. Mineral fuels top Mediterranean exports (US$ 221 billion) and are the third top imported commodity (US$ 133 billion) in terms of value. Overall, in terms of the value of energy trade, the top suppliers of the Mediterranean were Russia (US$ 52 billion), Saudi Arabia (US$ 22 billion) and Algeria (US$ 20 billion), with Libya in 7th place, according to available data for 2018. Energy exports, however, are largely directed at the region, with Italy the top market for Mediterranean energy exports (US$ 29.7 billion), followed by France (US$ billion 14.3) and Spain (US$ 12.5 billion). [32]
Intra-Mediterranean flows constitute a significant share of the total energy-related trade of all Mediterranean countries, except Israel–the latter due to security and political constraints. Over 75% of Croatia, Slovenia and Palestine’s exports are directed at the region, while for most other countries approximately 40%-60% of their energy-related exports is directed at the Mediterranean (graph 11). In terms of imports, energy dependency on the Mediterranean is high for Palestine (99.3%), Libya (89.1%), Montenegro (82.7%) and Cyprus (80.4%). The countries least dependent on Mediterranean energy imports are Israel (2.3%), Turkey (6.8%), France (15%) and Greece (18.6%) (Graph 12).
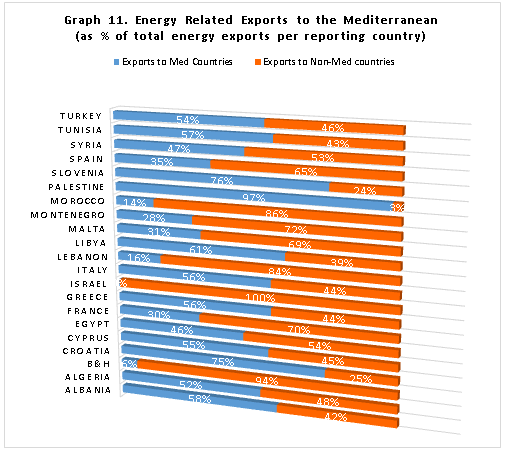
Source: Based on Mediterranean Growth Initiative, 2020. Note: Energy related exports (Mineral Fuels, Mineral oils and products of their distillation, bituminous substances, mineral waxes). The data for Bosnia & Herzegovina, Croatia, Cyprus, Egypt, France, Greece, Israel, Italy, Malta, Morocco, Slovenia, Spain, Tunisia and Turkey are for 2019. The data for Albania, Lebanon, Libya, Montenegro and Palestine are for 2018. The data for Algeria is for 2017. The data for Syria is for 2010.
Israel, Morocco and Lebanon are net energy importers. Historically, Israel has been an importer of natural gas, with a substantial portion of its needs supplied through the Arish-Ashkelon pipeline[33] from Egypt and a small amount from liquefied natural gas (LNG) imports via a floating regasification terminal installed in 2013. Since the Leviathan field discovery, multiple export agreements have been proposed with various countries including Egypt, Greece and Cyprus.[34] Morocco is a net importer of energy and depends on external resources for approximately 91% of its energy supply. It imports crude oil from Saudi Arabia, Iraq and Russia, natural gas from Algeria, and electricity from Spain.[35] A significant part of the country’s natural gas needs are covered by the Maghreb-Europe Pipeline, which transports natural gas between Algeria and Spain. Ownership of the Moroccan section is due to pass from Algeria to Morocco in 2021. Lebanon imports have been relatively stable in recent years, with fuel imports accounting for around 95% of the country’s overall energy supply. The plan to use the Arab Gas Pipeline to deliver natural gas from Egypt via Jordan and Syria has been subject to persistent disruption, due to security problems in the region. With security issues in Egypt and Syria limiting the possibility of overland deliveries, the majority of Lebanon’s energy imports arrive via its Mediterranean ports. Heavily depended on energy imports, Lebanon also receives electrical power from Turkish ‘power ships’—floating facilities have reportedly provided up to 40% of Lebanon’s power capacity during peak periods.[36] It has also imported electricity from both Syria (533,803 GWh in 2017 and 11,391 GWh in 2018) or/and Egypt (until 2012).[37]
“New oil and gas discoveries in the Eastern Mediterranean shifts in domestic consumption and European investors prioritizing green energy are reshaping the energy map of the region.”
The energy supply and demand strategy is at a turning point for all Mediterranean countries. New oil and gas discoveries in the Eastern Mediterranean, shifts in domestic consumption and European investors prioritizing green energy are reshaping the energy map of the region.
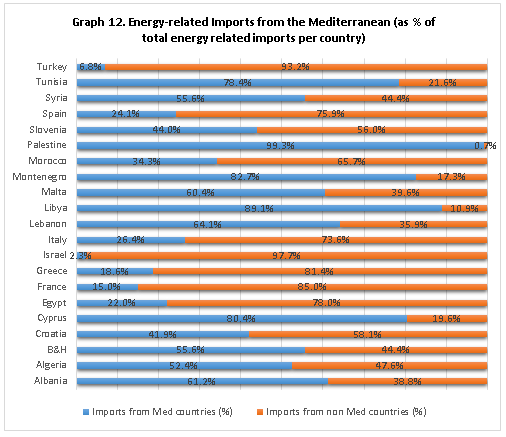
Source: Based on Mediterranean Growth Initiative, 2020. Note: Energy-related imports (Mineral Fuels, Mineral oils and products of their distillation, bituminous substances, mineral waxes). The data for Bosnia & Herzegovina, Croatia, Cyprus, Egypt, France, Greece, Israel, Italy, Malta, Morocco, Slovenia, Spain, Tunisia and Turkey are for 2019. The data for Albania, Lebanon, Libya, Montenegro and Palestine are for 2018. The data for Algeria is for 2017. The data for Syria is for 2010.
With an eye on the future
Regional economic linkages in the Mediterranean have two dominant features: On the one hand, there is considerable heterogeneity in terms of the countries’ performance in foreign trade, investment flows and energy (oil and gas) potential. On the other hand, there is a strong north-south element that shapes all intra-regional flows. These features indicate that, despite weak integration at a regional level, opportunities exist to strengthen intra-regional links as the Mediterranean further integrates into the global economy and benefits from long-standing multilateral and cooperative structures across the region. As the main drivers of regional dynamics in trade, investments and energy flows, the EU Mediterranean countries can play a key role in developing stronger regional links.
“Will the Mediterranean succeed in benefitting from the new economic context and redress its weaknesses to shape a resilient and integrated region?”
The underperformance of the Mediterranean in regional economic cooperation can be attributed to structural weaknesses (such as the lack of economic diversification in mainly Southern Mediterranean partners) and obstacles such as non-tariff impediments to trade (including high trade costs linked to poor logistics and high infrastructure costs) or an inadequate regulatory framework. Thus, far from being an integrated region, the Mediterranean is shaped by bilateral and sub-regional links. Still, the most pervasive challenges to intra-regional integration are political uncertainty and security threats. Most recently, regional interdependencies have been negatively affected by the wars in Libya and Syria, economic sanctions, and other restrictive measures imposed bilaterally or collectively which have disturbed the configuration of economic flows. Hence, in addition to addressing the structural weakness of the local economies and managing the new dynamics in global economy, it is equally important for governments to overcome political obstacles to regional economic growth.
The current regional tendencies towards asymmetries, north-south divides and bilateral axes will be embedded in a new context in the years ahead. What are the new dynamics that could affect the qualitative and quantitative features of economic integration in the Mediterranean? Over and beyond, of course, the growth path of the local economies and their ability to better integrate their production structures into the global value chain and capital flows, there are also new factors that will define both intra-regional dynamics and the region’s global standing. Crucial will be the rise of a circular economy, which will usher in changes across sectoral, legal and policy fields as well as modes of production and consumption, and which is linked to the transition to a blue and green economy on both the southern and northern shores of the Mediterranean. This new economic paradigm is creating a different context, primarily for the Euro-Mediterranean dialogue, a key driver of regional integration, as it shifts policy and financing priorities. Linked to that, the shift to green energy in an effort to combat climate change is also expected to impact on the Mediterranean economy in several ways, affecting inter alia national resources and the structure of foreign trade in terms of commodities, maritime energy transport flows, and the type of incoming investments. The Mediterranean could also be influenced greatly by a new trend in consumption that prioritizes locally-produced goods and services, which could boost intra-regional links by changing supply chains from ‘global’ to ‘regional’. Will the Mediterranean succeed in benefitting from the new economic context and redress its weaknesses to shape a resilient and integrated region? This is the key policy challenge faced on both shores of the Mediterranean.
[1] Albania (ALB), Bosnia and Herzegovina (BIH), Cyprus (CYP), Algeria (DZA), Egypt (EGY), Spain (ESP), France (FRA), Greece (GRC), Croatia (HRV), Israel (ISR), Italy (ITA), Lebanon (LBN), Libya (LBY), Morocco (MAR), Malta (MLT), Montenegro (MNE), Palestinian Territories, Slovenia (SVN) Syria (SYR), Tunisia (TUN), Turkey (TUR).
[2] Randone, M. et al., (2017), Reviving the Economy of the Mediterranean Sea: Actions for a Sustainable Future, WWF Marine Initiative, WWF Report (2017), Rome, p. 9.
[3] Ibid, p.16.
[4] Petrick K., J. Fosse, H. Lammens, F. Fiorucci, et al. (2017), Blue Economy in the Mediterranean, Union for the Mediterranean Report, p.25, available at: https://ufmsecretariat.org/wp-content/uploads/2017/12/UfMS_Blue-Economy_Report.pdf.
[5] Ibid, p.39.
[6] Virto M.C., L. Tode (2014), Economic and social analysis of the uses of the coastal and marine waters in the Mediterranean, characterization and impacts of the Fisheries, Aquaculture, Tourism and recreational activities, Maritime transport and Offshore extraction of oil and gas sectors, Technical Report, Plan Bleu, Valbonne, p.122, available at: https://planbleu.org/sites/default/files/publications/esa_ven_en.pdf.
[7] ITF (2019), ITF Transport Outlook 2019, OECD Publishing, Paris, 2019, pp. 17-18.
[8] MGI (2017), A look at trade in the Mediterranean, 26 June, available at: https://www.mgi.online/content/2017/6/26/a-look-at-trade-in-the-mediterranean.
[9] The Mediterranean ports: connectivity in the middle of a vast network of trade lanes, Research Report, DocksTheFuture project, 11 November 2020, available at: https://www.docksthefuture.eu/.
[10] Basbug G., C. Elgin (2020), Economic Policy Responses to COVID-19: The case of EU and non-EU Mediterranean Countries, Responding to the Challenges of COVID-19 in the Mediterranean, CMI – FEMISE, COVID-19 MED Briefs, available at: https://www.femise.org/wp-content/uploads/2020/11/CMI-FEM-Brief-9.pdf.
[11] Based on World Bank Development Indicators, World Bank, available at: https://data.worldbank.org/indicator/NE.EXP.GNFS.ZS?view=chart.
[12] The value of Montenegro’s foreign trade in 2018 was US$3.4 billion; Palestine’s was US$7.6 billion. UN Comtrade Statistics, United Nations, available at: http://comtrade.un.org/data.
[13] Mediterranean Growth Initiative data, available at: https://www.mgi.online.
[14] Ibid.
[15] European Commission (2020), Euro-Mediterranean Partnership, May, available at: https://ec.europa.eu/trade/policy/countries-and-regions/regions/euro-mediterranean-partnership/.
[16] Calculations of the author based on UN Comtrade statistics.
[17] Mediterranean Growth Initiative data, available at: https://www.mgi.online. Information presented is based on UN Comtrade data for 2010-2018.
[18] Except for Algeria (0.81% of GDP) and Turkey (1.16% of GDP). Source: World Development Indicators, World Bank.
[19] Based on World Development Indicators database, World Bank.
[20] Based on Eurostat (online data code: bop_fdi6_pos).
[21] Data for Egypt: External Position of the Egyptian Economy, Central Bank of Egypt, FY 2018/19, vol. 66, available at: https://www.cbe.org.eg/en/EconomicResearch/Publications/Pages/ExternalPosition.aspx.
Data for Tunisia: Rapport sur l’investissement international direct en Tunisie 2019, Rapport des-IDE-2019, Foreign Investment Promotion Agency (FIPA) Tunisia, 24 July 2020, available at: www.investintunisia.tn. Data for Morocco: Séries statistiques, Office des Changes 2020, available at: https://www.oc.gov.ma/fr/etudes-et-statistiques/series-statistiques. Data for Israel, Greece and Italy: OECD Statistics (https://stats.oecd.org/Index.aspx). Data for Turkey: Investment Statistics [Yatırım İstatistikleri], Turkish Ministry of Industry and Technology, available at: https://www.sanayi.gov.tr/istatistikler/yatirim-istatistikleri. Data for Spain: Balance of Payments and International Investment Position, Bank of Spain, available at: https://www.bde.es/webbde/en/estadis/infoest/temas/sb_extbppii.html. Data for Albania: Foreign Direct Investments Position, Bank of Albania, available at: https://www.bankofalbania.org/Statistics/External_sector_statistics/Foreign_Direct_Investments/Foreign_direct_investments_position.html.
[22] Based on OECD Statistics, available at https://stats.oecd.org/Index.aspx.
[23] Mediterranean Growth Initiative data, available at: https://www.mgi.online.
[24] Inaugural Report, Mediterranean Growth Initiative, 2016, p. 184, available at: https://static1.squarespace.com/static/58b6e0adbf629ae535e05ff5/t/58eb6356e58c6214d41d08e9/1491821542341/MGI_Economic_Indicators_Report.pdf.
[25] Energy trade visualization tool, Eurostat, available at: https://ec.europa.eu/eurostat/cache/infographs/energy_trade/entrade.html#0?geo=HR&year=2018&language=EN&trade=imp&siec=G3000&filter=top5&fuel=gas&unit=TJ_GCV&defaultUnit=TJ_GCV&detail=1&chart=.
[26]Ibid.
[27] EU imports of energy products- recent developments, Eurostat, 15 October 2020, available at: https://ec.europa.eu/eurostat/statistics-explained/pdfscache/46126.pdf.
[28] Algeria, U.S. Energy Information Administration (EIA), 25 March 2019, available at: https://www.eia.gov/international/analysis/country/DZA.
[29] Shedding light on energy in the EU, 2020 edition, Eurostat, available at: https://ec.europa.eu/eurostat/cache/infographs/energy/bloc-2c.html.
[30] Statistical Review of World Energy June 2015, 64th edition, EIA data and BP, available at: large.stanford.edu/courses/2015/ph240/zerkalov2/docs/bp2015.pdf.
[31]Egypt-Oil & Gas, Energy Resource Guide, 2020 Edition, U.S. Department of Commerce, available at: https://www.trade.gov/energy-resource-guide-egypt-oil-and-gas.
[32] MGI (2017), A look at trade in the Mediterranean, 26 June, available at: http://www.mgi.online.
[33] The pipeline was built to connect to the Arab Gas Pipeline, but has ceased operation due to its feeder pipeline being sabotaged and to gas shortages in Egypt. The gas shortages in Egypt have led to an agreement whereby Israel now operated the pipeline in the opposite direction (i.e. from Israel to Egypt).
[34] OECD, (2016), Israel, Country Note, available at: https://www.eia.gov/international/analysis/country/ISR.
[35] International Energy Agency (2014), Morocco In-depth Energy Review, Ministère de l’Énergie, des Mines, de l’Eau et de l’Environnement: chiffres clés du secteur de l’énergie, available at: http://www.mem.gov.ma/SitePages/ChiffresCles1/ChCleEnAnnuels.aspx.
[36] Lebanon looks to reform ailing electricity sector, 24 May 2029, available at: https://www.power-technology.com/comment/lebanon-energy-plan/.
[37] UN Statistics Division (2019), Technical assistance to Lebanon on improving energy statistics for sustainable development: Assessment mission report, Beirut, July, available at: https://unstats.un.org/unsd/energystats/events/2019-Beirut/Lebanon%20Report%20Final.pdf.